As the Federal Reserve raises interest rates, the cost savings for Veterans’ Affairs home loans could make a substantial difference in affordability
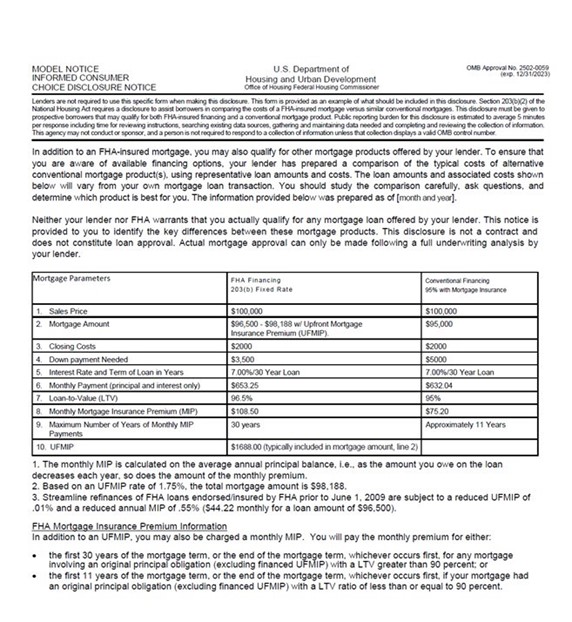
WASHINGTON – U.S. Senators Ben Cardin (D-Md.) and John Boozman (R-Ark.) have introduced legislation, the VA Loan Informed Disclosure Act of 2023 (VALID Act/S. S.2496), that will require a side-by-side comparison between conventional, Federal Housing Administration (FHA), and Veterans’ Affairs (VA) home loans to be included in the U.S. Department of Housing’s “Informed Consumer Choice Disclosure Notice.” VA home loans can offer veterans, active duty, reservists, and national guard members lower down payments, interest rates, and closing costs, saving them tens of thousands of dollars over the life of the loan. Despite these benefits, overall usage of VA home loans is surprisingly low, with only 10 to 15 percent of veterans reported as using the benefit.
“Buying a home often is the most expensive purchase an individual makes in their lifetime. For our veterans and servicemembers who have earned these benefits through service to our nation, we need to make it easier for them to learn about and access the savings they deserve. Far too many are missing out on tens of thousands of dollars of savings; we aim to change that by making the disclosures and comparisons clear and upfront,” said Senator Cardin.
“We can help fulfill the dream of homeownership by informing veterans about the benefits they have earned. VA’s home loans are underutilized, but this bipartisan legislation will provide the men and women who served in uniform another opportunity to learn about resources available to them to save money and meet the needs of their families,” Senator Boozman said.
The VALID Act (S.2496), will provide potential homebuyers a comprehensive picture of veterans’ financing options through a side-by-side comparison of conventional, FHA, and VA home loans. This legislation will help veterans make more informed choices about their financing options and potentially increase the utilization of VA home loans.
“As part of its ongoing commitment to veterans, VAREP applauds Senators Ben Cardin and John Boozman for support of expansion of legislation to include VA loans in the Informed Consumer Choice Disclosure, addressing a key informational gap. This change will empower veterans and servicemembers to make fully informed home loan decisions as they set their sights on the American dream of homeownership,” said G2 Varrato, National Legislative Committee Director of the Veterans Association of Real Estate Professionals (VAREP).
The bill text may bedownloaded here.
Below is a sample of a current Informed Consumer Choice Disclosure Notice. The VALID Act would add an additional column for VA home loans.
The United States, as has most of the world, has made stricter and stricter building codes over the years. However, the United States does not have any national building codes the states or local cities make their own rules. I have found the states or areas with the strictest building codes also have the highest prices. The harder it is to build or repair homes, the more expensive they become because people stop building, and when they do build, they have to raise the price for it to make sense. So what areas have the strictest building codes in the US?
How do building codes change over time?
100 years ago there were basically no building codes. Anyone could build whatever they wanted, wherever they wanted with some minor restrictions. Over time, the government decided that houses and commercial properties were not safe enough and there needed to be standards set for construction and even repairs. Some cities, states, and counties choose to have stricter codes than others and the federal government has let local governments make those decisions.
You can see how building codes have changed over time by looking at houses built in different eras. 100 years ago some houses were built with amazing carpentry and we often hear “they don’t build them like they used to”. There were also many houses that were built like shacks that have since fallen down. I have bought many of those shacks as a real estate investor and am surprised many of those houses lasted as long as they did.
You can see improvements in houses by looking at houses from different eras. Houses that are 100 years old may not have any windows in the basement where egress windows are now required. Houses from 50 years ago had very little insulation whereas houses now are required to have a minimum amount. You used to be able to put three layers of shingles on a roof and now most areas only allow one. Areas close to the coast may require hurricane glass and reinforced structures.
The stricter building codes make houses safer and more energy efficient but they also make them more expensive.
[embedded content]
What areas do not have building codes?
Believe it or not, there are still some areas in the US that do not have building codes! These states do not have building codes:
Alabama
Arizona
Colorado
Illinois
Mississippi
Missouri
North Dakota
Tennessee
Texas
West Virginia
Wyoming
While these states do not have standard building codes, the local cities and counties usually do. I live in Colorado and while there is no standard building code for the entire state, Denver and Boulder have some of the strictest building codes in the nation. Louisville, where the Marshall Fires occurred in 2021 requires fire sprinkler systems in all new houses although they did remove that requirement for houses destroyed in the fire!
Here are some counties without building codes (from https://offgridgrandpa.com/states-and-counties-with-no-building-codes/):
Delta County in Colorado
Montezuma County in Colorado
Arcosanti Urban Laboratory in Arizona
Brewster County in Texas
Wonder Valley in California
Marfa County in Texas
Terlingua Texas
Miller County Missouri
In these areas, you might be able to get away with building whatever you want as long as you are not in a city with more strict codes but remember codes can always change!
Do you need to get building permits?
What areas have the strictest building codes?
I found it interesting but not surprising that the areas with the strictest building codes tend to have the highest prices. When you look at the list below the most strict areas are definitely the most expensive as well.
You can read up on how they made the list and what the numbers mean here: https://realestate.wharton.upenn.edu/wp-content/uploads/2022/04/w835.pdf
Why do tougher building codes make it more expensive to build?
You will find that the most expensive places in the world and the US tend to have the strictest building codes. It is not real estate investors that push up prices as many people claim, it is the government. The harder it is to build and repair houses, the more expensive they are going to be when they are built. The harder it is to build houses, the fewer houses that will be built which will also cause an imbalance in the housing market driving prices up even further. You will also find fewer investors in these areas because it is hard to build, expensive to own, and a pain to do business in those areas.
Conclusion
Building codes do make houses safe and more energy efficient but they also make houses more expensive at a time when houses are becoming less and less affordable. If you are pushing for stricter building codes and more energy-efficient homes, you are also pushing for higher prices. While homes in the US seem to be out of range for many people thanks to high-interest rates, remember the US actually has the 5th most affordable housing in the world.
Market trends in the past decade The white paper presented the differences between 2013 and 2023. Mortgage rates were just 3.98% back in 2013 and are sitting at 7.21% year to date. The number of new single-family homes completed in 2013 was 569,000 compared to more than one million in 2023 YTD. The average price … [Read more…]
With its tree-lined streets, historic architecture, and a warm, small-town atmosphere, La Plata exudes a timeless charm. This quaint town in Maryland has plenty to offer – including historic landmarks, a strong sense of community, and wonderful restaurants. Whether you just moved into a new home in La Plata or you’ve lived here for awhile, let’s explore some of the restaurants in La Plata that locals love.
#1: Marie’s Diner
Cuisine Type: Diner, American Restaurant Location: 6325 Crain Hwy, La Plata, MD 20646 Website: Marie’s Diner
First on our list is the beloved Marie’s Diner. A charming American restaurant known for its classic diner atmosphere, Marie’s Diner offers a menu filled with delicious comfort food options. From juicy burgers to fluffy pancakes, you can find all your favorite American dishes here. Don’t forget to try their famous milkshakes for a sweet treat after your meal.
#2: The Charles
Cuisine Type: New American Restaurant Location: 417 Charles St, La Plata, MD 20646 Website: The Charles
The Charles is a New American restaurant located in La Plata, MD. With a menu featuring a variety of dishes inspired by local and seasonal ingredients, guests can expect a unique dining experience. From their signature dishes like the Chesapeake Bay Crab Cakes to their creative cocktails, The Charles offers a delicious and innovative taste of American cuisine.
#3: Pizza Hotline
Cuisine Type: Pizzeria Location: 203 Charles St, La Plata, MD 20646 Website: Pizza Hotline
Pizza Hotline is a popular pizzeria specializing in a variety of delicious pizzas, with a menu that includes classics like pepperoni and margherita, as well as specialty options. The restaurant offers a casual and welcoming atmosphere, making it a great spot for a quick bite.
#4: La Tolteca
Cuisine Type: Mexican Restaurant Location: 6625 Crain Hwy, La Plata, MD 20646 Website: La Tolteca
La Tolteca is a delicious restaurant to visit in La Plata. A popular Mexican spot, this is a great place to catch up with friends over some chips and salsa, or indulge in tasty tacos and enchiladas with family.
#5: Benny’s Sub Shop
Cuisine Type: Chinese Restaurant Location: 6505 Crain Hwy, La Plata, MD 20646 Website: Benny’s Sub Shop
Benny’s Sub Shop offers a unique twist on Chinese cuisine with their specialty sub sandwiches. In addition to traditional options, such as fried rice and lo mein, they also serve a variety of delicious sub options.
#6: Charles Street Bakery
Cuisine Type: Bakery Location: 507 Charles St, La Plata, MD 20646 Website: Charles Street Bakery
Charles Street Bakery is a delightful bakery in La Plata that specializes in a variety of baked goods, including fresh bread, pastries, and cakes. With their warm and inviting atmosphere, it’s the perfect place to satisfy your sweet tooth or pick up a delicious treat for any occasion. Be sure to try their signature cupcakes and don’t miss out on their famous cinnamon rolls, which are a customer favorite.
#7: Hunan Star Chinese Restaurant
Cuisine Type: Chinese Restaurant, Sushi Location: 6277 Crain Hwy, La Plata, MD 20646 Website: Hunan Star Chinese Restaurant
Another great restaurant in La Plata to check out is Hunan Star Chinese Restaurant is a popular eatery located in La Plata, MD. From classic Chinese cuisine to tasty sushi rolls, Hunan Star has something for everyone.
#8: B. Doughnut
Cuisine Type: Donut Shop Location: 6700 Crain Hwy, La Plata, MD 20646 Website: B. Doughnut
Got a sweet tooth? B. Doughnut dishes out unique and delicious donuts that are freshly made every day. From classic glazed donuts to specialty flavors like maple bacon and cookies and cream, there are plenty of options.
A great spot in La Plata for sushi is Bento Sushi. Their menu includes classic rolls, sashimi, and nigiri. Don’t miss out on their specialty rolls, like the Dragon Roll or the Spicy Tuna Roll, which are always a hit among La Plata locals.
At Galazio Restaurant, you can find a variety of traditional Greek dishes such as moussaka, spanakopita, and souvlaki. The restaurant has a cozy and welcoming atmosphere, perfect for enjoying a delicious meal with family and friends.
#11: Eastern Chinese Restaurant
Cuisine Type: Chinese Restaurant Location: 6619 Crain Hwy, La Plata, MD 20646 Website: Eastern Chinese Restaurant
Eastern Chinese Restaurant is a popular Chinese restaurant in La Plata, MD. With a focus on traditional Chinese cuisine, they have an extensive menu offering something for everyone.
#12: Foster’s Grille
Cuisine Type: American Restaurant, Wings Joint Location: 6390 Crain Hwy Ste 105, La Plata, MD 20646 Website: Foster’s Grille
Next up on our list of must-try restaurants in La Plata is Foster’s Grille. Their menu offers a variety of classic American dishes such as burgers, sandwiches, and salads. However, what sets Foster’s Grille apart is their deliciously crispy and flavorful chicken wings. With a casual and friendly atmosphere, it’s a great place to grab a bite and watch a game with family and friends.
#13: Texas Ribs & BBQ
Cuisine Type: BBQ Joint, American Restaurant Location: 7415 Crain Hwy, La Plata, MD 20646 Website: Texas Ribs & BBQ
Indulge in the mouthwatering flavors of Texas-style ribs and BBQ at Texas Ribs & BBQ. You can expect to find classic BBQ dishes like tender ribs, pulled pork, and smoky brisket on their menu. The relaxed and rustic atmosphere adds to the charm of this local favorite.
By the end of 2022, 27 million Americans had an outstanding personal loan balance with the average amount owed being $11,116. The interest rates of these loans are also the highest they’ve been since 2011 at 11.23 percent.
Sources: TransUnion and the St. Louis Federal Reserve
As of the second quarter in 2022, Americans owed over $192 billion in personal loans, according to TransUnion®. This was a 31% increase from 2021 and is thought to be due to the financial hardships Americans experienced during the COVID pandemic that overwhelmed the nation in 2020.
If you’re one of the many Americans who took out a personal loan in early 2022, the good news is that interest rates were very low, according to the St. Louis Federal Reserve. Since then, rates have reached new highs, so many Americans are struggling to pay back these loans.
Understanding the current trends in personal loans can help you see where you stand financially. We’ve gathered 10 personal loan statistics that include the most common reasons people take out personal loans, delinquency rates and which states have the highest personal loan debt to help you make better financial decisions if you’re accumulating too much debt.
In This Piece
Must-know Personal Loan Statistic Findings
Millions of Americans are taking out personal loans, and the following are some of the most interesting facts on the topic.
Get matched with a personal
loan that’s right for you today.
Learn
more
27 million Americans have personal loan debt (TransUnion)
At the end of 2022, the average new loan amount was $8,018 (TransUnion)
The average amount owed in personal loan debt was $11,116 at the end of 2022 (TransUnion)
In November of 2022, personal loan interest rates were the highest they’ve been since May of 2011 (St. Louis Federal Reserve Bank)
New Jersey has the highest average new personal loan account balance at $13,494 (TransUnion)
Average Personal Loan Debt in America
According to TransUnion, Americans owed roughly $9,896 on average as of the first quarter in 2022, the highest it’s been in recent years. Americans took out loans at an average of $6,656 per loan, which was over $1,000 more than in the previous quarter of 2022.
The amount owed per borrower dropped significantly between Q2 and Q3 in 2022, but by the end of the fourth quarter, the average amount owed increased by over 100 percent with the new loan amount dropping to $8,018.
The increase in personal loan debt may have been due to the inflation the country experienced in 2022. TransUnion also reports that there were more loans approved to “super prime borrowers,” or those with credit scores over 720, stating, “On a percentage basis, personal loan originations for subprime and near-prime borrowers increased in the single digits [year over year] whereas super prime borrowers experienced a 33% rise in the third quarter.”
How Many Americans Have Personal Loans?
The amount of Americans taking out personal loans increased 12 percent from 23.9 million in the first quarter of 2022 to 27 million by the fourth quarter.
Prior to the beginning of the COVID-19 pandemic, the total amount of personal loan borrowers was 23.3 million at the end of 2019 and dropped to 21.2 million by the end of 2020. The number of borrowers then grew back to 22.8 million in the following fourth quarter of 2021 and continued to grow as the pandemic regressed.
Quarter
Q4 2022 Average new account balance
Q4 2019
23.3 million
Q4 2020
21.2 million
Q4 2021
22.8 million
Q4 2022
27 million
The Most Common Reasons to Take Out a Personal Loan
LendingTree conducted a survey of their users in 2022 and found that the most common reason consumers took out personal loans was to pay down other debts. Over 58 percent of borrowers used these loans to pay down debt, and the other main reasons included credit card refinancing, home improvements and other major purchases.
Rank
Reason
Percentage of respondents
1
Debt consolidation
41%
2
Other
17.3%
3
Credit card refinance
17.3%
4
Home improvements
6.2%
5
Major purchase
4.1%
6
Medical expenses
3.0%
7
Moving/relocation
2.9%
8
Everyday bills
2.9%
9
Car financing
1.7%
10
Car repair
1.1%
11
Business
0.9%
12
Vacation
0.5%
13
Homebuying
0.4%
14
Wedding expenses
0.4%
Average Personal Loan Interest Rates
During the second quarter of 2022, the Federal Reserve Bank of St. Louis reported that interest rates reached an all-time low of 8.73 percent. By the end of the year, these rates were the highest they’ve been since 2011 at over 11.2 percent.
Personal Loan Debt Compared to Other Debts
Based on TransUnion data, personal loans account for less than four percent of the total number of accounts when compared to other types of loans, such as credit cards, home and auto loans.
Account type
Number of accounts
Percentage of accounts
Credit card
518.4 million
76.3%
Auto loan
81.2 million
11.9%
Mortgage loan
52.6 million
7.83%
Personal loan
27 million
3.97%
It’s also important to note that not all credit card accounts carry a balance.
Personal Loan Delinquency Rates
Delinquent accounts are accounts 60 days or more past due and can hurt your credit score. The Q4 TransUnion report shows that the delinquency rate dropped year over year between 2019 and 2020, but was up 53 percent as of 2022, with an overall delinquency rate of 4.14 percent.
Quarter
Delinquency rate
Q4 2019
3.48%
Q4 2020
2.7%
Q4 2021
3%
Q4 2022
4.14%
TransUnion’s 2022 Credit Snapshot shows that in the last month of the report, those with the lowest credit scores have the highest delinquency rate of 23.9 percent, while super prime borrowers are only at 12 percent.
Credit score range
Percentage of delinquent borrowers
Subprime (300 to 600)
23.9%
Near prime (601 to 660)
23.7%
Prime (661 to 720)
23.3%
Prime plus (721 to 780)
17%
Super prime (781 to 850)
12%
Personal Loan Statistics by State
TransUnion’s 2022 Credit Snapshot reports that New Jersey has the highest average new account balance at over $13,000, and Oklahoma has the lowest at $3,170. Although Oklahoma has the lowest new account balance, they have the highest delinquency rate at 7.73 percent.
State
Q4 2022 Average new account balance
Q4 2022 Delinquency rate
AK
$10,296
2.9%
AL
$4,362
6.59%
AR
$7,089
5.18%
AZ
$9,343
3.78%
CA
$10,454
3.47%
CO
$12,322
2.03%
CT
$11,712
2.57%
D.C.
$9,016
6.55%
DE
$9,146
4.04%
FL
$8,379
3.94%
GA
$8,621
5.18%
HI
$12,224
2.28%
IA
$7,443
2.94%
ID
$9,072
4.38%
IL
$9,236
3.46%
IN
$7,439
2.97%
KS
$8,349
3.05%
KY
$6,875
3.36%
LA
$6,797
5.07%
MA
$12,518
2.24%
MD
$10,956
2.77%
ME
$6,651
1.67%
MI
$7,052
3.21%
MN
$10,692
3.73%
MO
$6,522
6.69%
MS
$5,179
4.96%
MT
$9,326
2.53%
NC
$10,035
3.03%
ND
$8,051
1.89%
NE
$7,755
3.65%
NH
$11,719
2.31%
NJ
$13,494
3.49%
NM
$5,418
6.31%
NV
$8,839
3.74%
NY
$11,843
2.77%
OH
$7,595
3.75%
OK
$3,170
7.73%
OR
$10,523
2.93%
PA
$10,418
3.06%
RI
$8,744
2.14%
SC
$5,924
4.89%
SD
$9,945
2.06%
TN
$5,355
5.38%
TX
$4,952
6.33%
UT
$7,966
4.23%
VA
$9,875
3.37%
VT
$6,180
0.82%
WA
$9,570
2.94%
WI
$6,489
3.95%
WV
$10,864
1.96%
WY
$7,698
2.66%
Personal Loan Statistics by Type of Lender
More and more Americans are turning to financial technology companies, also known as FinTech, for their personal loans. These are online banking services that are done via a company’s website or mobile app, and 32.9 percent of all personal loans are done through these types of companies.
Lender type
Distribution of total balances
FinTech
32.9%
Banks
20.5%
Credit unions
19.7%
Other finance companies
26.9%
Can Personal Loan Debt Affect Your Credit Score?
If you’re one of the 27 million Americans with a personal loan, you don’t have to let your debt harm your credit score. As you’ve learned from these personal loan statistics, many Americans have turned to personal loans to pay off other debts, but many people are delinquent with their payments, which can hurt their scores.
Credit.com provides a variety of credit tools and tips to help you work to repair and improve your credit. You can learn more about our services, like ExtraCredit, or click here to get your free credit report card.
PNC has increased the signup bonus on the Cash Rewards Visa card to $200 after $1,000 spend (previously $100) within the first three billing cycles. You can see that offer on PNC here.
Additionally, there is an in-branch offer which will offer double cashback during the first year. PNC will automatically post any earned double cash back to your account one year after opening.
Offer is valid 9/6/23 – 11/6/23
You can try calling into a banker at a PNC branch to see if they can process the branch offer over the phone, just make to get confirmation that it’s for the double cash back offer.
You can see an image of the offer on this website.
Card Details
No annual fee
Sign up bonus of $100 after $1,000 in purchases
Card earns at the following rates ($8,000 annual cap on the 2%/3%/4% categories):
4% cash back on gas purchases
3% cash back on dining purchases
2% cash back on grocery purchases
1% cash back on all other purchases
Introductory 0% APR on balance transfers for the first 12 billing cycles following account opening when the balance is transferred within the first 90 days following account opening
You can redeem for cash back when you have $25 or more in your account
Applications restricted to the following states: AL, DC, DE. FL, GA, IL, IN, KY, MD, MI, MO, NC, NJ, OH, PA, SC, VA, WI, WV
Read our full review here.
Our Verdict
The $200 signup bonus can be done online, and for the hassle of going in branch you’ll hopefully be able to get this offer with the double cashback. If someone can max out the $8,000 on gas, that would get you an extra $320 in cashback (that’s in additional to the generous 4% regular earn rate on gas).
PNC branches are around in many states, listed above. I can see this being a nice deal for someone who can max out the gas category, and possibly even for the other categories. Some people might also consider signing up for the online offer to get the $200 signup bonus. The ongoing rate of of 4% on gas is pretty nice too, irrespective of any signup bonus.
In the United States, it’s illegal to drive a car without car insurance. Depending on the state you’re driving in, the consequences of doing so can range from a fine to a misdemeanor on your record. So, if you’re planning on hitting the road anytime soon, be sure to purchase car insurance to avoid penalties.
In this article, we’ve researched the average cost of car insurance by state to give you a better idea of how much to budget.
Key findings:
According to AAA, the national average cost of car insurance for a full-coverage policy was $1,588 in 2022.
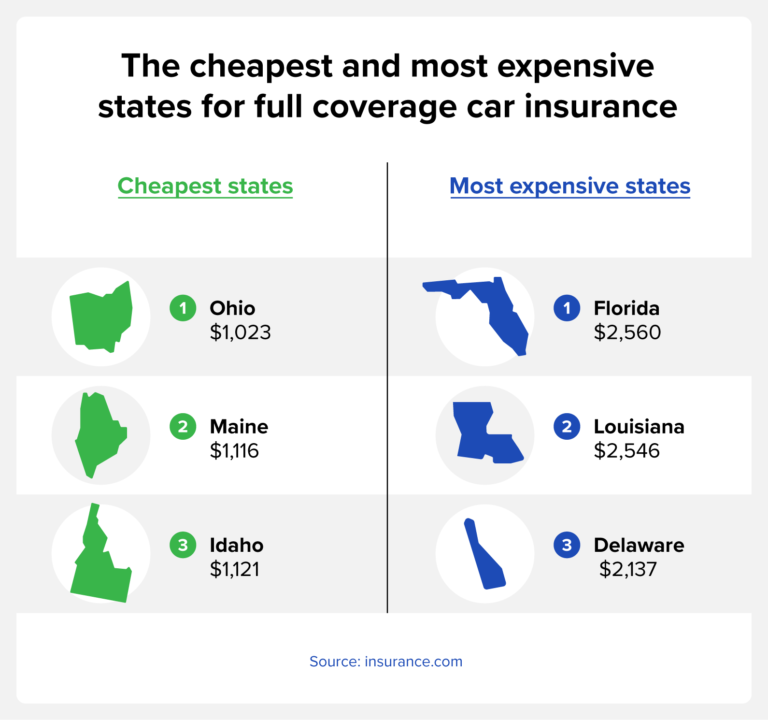
On average, the cheapest states for full coverage car insurance are Ohio, Maine and Idaho, while the most expensive states are Florida, Louisiana and Michigan.
USAA, Geico and State Farm offer the cheapest minimum coverage plans, while USAA, Geico and Nationwide offer the cheapest full-coverage insurance.
The average cost of car insurance tends to decrease with age, but starts to rise again around age 70.
Individuals with high credit scores pay lower car insurance premiums on average compared to those with poor credit.
How much is car insurance?
According to AAA, the national average cost of car insurance for a full-coverage policy was $1,588 in 2022. This figure is based on an under 65 years old driver who lives in the city or suburbs, has over six years of driving experience, and has not been involved in any accidents.
Average cost of car insurance by state
When calculating the cost of car insurance, the state you live in plays a role in how much you can expect to pay. This is because factors like population density, climate, road conditions and crime rate in your area can play a part in the likelihood that you’ll file a claim.
According to insurance.com, the cheapest states for car insurance if you’re looking for minimum coverage are Iowa, South Dakota and Wyoming costing an average of $263, $267, and $293, respectively. Meanwhile, the cheapest states for full coverage auto insurance are Ohio ($1,023), Maine ($1,116), and Idaho ($1,121).
The most expensive states for car insurance in terms of minimum coverage are New Jersey, Florida, and New York where drivers pay an average of $989, $908 and $875, respectively. For full coverage insurance, drivers in Florida ($2,560), Louisiana ($2,546), and Delaware ($2,137) pay the most in the country on average.
State
Minimum coverage
Full coverage
AK
$336
$1,359
AL
$420
$1,542
AR
$422
$1,597
AZ
$494
$1,617
CA
$582
$2,115
CO
$467
$1,940
CT
$773
$1,750
DE
$821
$2,137
FL
$908
$2,560
GA
$567
$1,647
HI
$389
$1,306
IA
$263
$1,321
ID
$326
$1,121
IL
$484
$1,578
IN
$384
$1,256
KS
$389
$1,594
KY
$717
$2,105
LA
$726
$2,546
MA
$523
$1,538
MD
$607
$1,640
ME
$330
$1,116
MI
$711
$2,133
MN
$479
$1,493
MO
$525
$2,104
MS
$434
$1,606
MT
$389
$1,692
NC
$396
$1,368
ND
$340
$1,419
NE
$350
$2,018
NH
$411
$1,307
NJ
$989
$1,901
NM
$376
$1,505
NV
$683
$2,023
NY
$875
$2,020
OH
$308
$1,023
OK
$352
$1,797
OR
$551
$1,244
PA
$398
$1,445
RI
$648
$1,845
SC
$628
$1,894
SD
$267
$1,581
TN
$368
$1,373
TX
$520
$1,875
UT
$526
$1,469
VA
$469
$1,321
VT
$306
$1,158
WA
$505
$1,371
WI
$375
$1,499
WV
$474
$1,610
WY
$293
$1,736
Average cost of insurance by company
Another factor that’s going to influence how much you can expect to pay for car insurance is the specific company you purchase your plan through.
According to U.S. News & World Report, USAA, Geico and State Farm offer the cheapest minimum coverage plans, while USAA, Geico, and Nationwide offer the least-expensive full-coverage insurance.
Farmers, Progressive, and Nationwide offer the most expensive minimum coverage rates while Allstate, Farmers, and Progressive offer the most expensive full coverage plans.
Insurance company
Minimum coverage
Full coverage
Allstate
$1,961
$2,138
American Family
$1,327
$1,388
Farmers
$1,782
$2,059
Geico
$1,064
$1,238
Nationwide
$1,347
$1,338
Progressive
$1,440
$1,650
State Farm
$1,191
$1,348
Travelers
$1,290
$1,448
USAA
$948
$1,056
Average cost of insurance by age
According to CarInsurance.com, the cost of both minimum and full coverage car insurance tends to decrease with age, as seen in the chart below. However, there is an uptick around age 70 where rates start to go back up.
Age
Minimum coverage
Full coverage
20
$1,109
$3,532
30
$539
$1,785
40
$520
$1,682
50
$496
$1,581
60
$482
$1,511
70
$554
$1,661
Average cost of insurance for young drivers
Young drivers are the most expensive age group to insure. Although there are a few exceptions, insurance rates decrease with age among young drivers.
Age
Minimum coverage
Full coverage
16
$2,402
$7,203
17
$1,971
$5,924
18
$1,706
$5,242
19
$1,234
$3,874
20
$1,109
$3,532
21
$884
$2,864
22
$794
$2,593
23
$736
$2,415
24
$690
$2,267
Average cost of insurance by credit score
According to the Insurance Information Institute, your credit score is a good indicator of how many insurance claims you’ll file. As a result, insurance companies use credit scores to determine risk, and those with a good credit score pay cheaper premiums. The Zebra found that individuals with poor credit pay approximately 114% more than those with great credit.
Credit score
Average annual rate
Very poor (300-579)
$2,887
Average (580-669)
$2,296
Good (670-739)
$1,912
Excellent (740-799)
$1,606
Exceptional (800-850)
$1,350
What factors affect your car insurance rate?
As you can see from the above charts, the cost of car insurance varies by the following factors:
Age: Typically, young drivers under the age of 25 and senior drivers over the age of 65 are charged more for car insurance.
State of residence: Since the minimum coverage required varies by state, your location is one of the factors that will influence the price.
ZIP code: In addition to your state of residence, your ZIP code will also play a role in the cost of insurance since your vehicle is more likely to be damaged in certain areas, such as ZIP codes with high crime rates. Typically, the cost of car insurance will be greater in cities than in rural areas.
Marital status: Statistically, married drivers are less risky than single drivers resulting in a lower insurance cost.
Gender: Based on risk, male teenage drivers tend to have the highest cost of car insurance of any demographic.
Credit history: Those with a low credit score tend to pay higher premiums than individuals with good credit.
Driving record: Since car insurance premiums are based on risk, individuals with a good driving record can expect to pay lower premiums, while those with a poor driving record may experience increased rates.
Car make and model: You may pay less if you drive a vehicle that insurance companies deem safe. On the other hand, you’re likely to pay more if you drive a small sports car since they pose a higher risk.
Mileage: Higher annual mileage increases the risk you’ll get into an accident and will likely raise your premiums.
High-risk violations: Driving under the influence andat-fault accidents are examples of violations that may result in you being considered a high-risk driver.
What’s the difference between full and minimum coverage?
Minimum coverage car insurance — liability coverage — is required in most states and is used if you’re at fault in an accident. This coverage will pay for damages and injuries of the other party when you’re responsible for the incident.
On the other hand, full coverage insurance, or collision coverage, includes liability coverage plus damage caused to your own vehicle. Keep in mind that lenders often require you to obtain full coverage insurance before you get an auto loan.
FAQ
Below, we’ve answered some common questions regarding the cost of auto insurance.
Can my driving record affect my car insurance rate?
Your driving record is one of the factors that affects your car insurance rate. As a result, those with traffic violations or accidents on their record can expect to pay higher premiums.
Does your car insurance cost go down after you pay off your car?
Your care insurance cost doesn’t typically go down after your pay off your car. However, you do have the option to decrease the amount of coverage on your vehicle once it’s paid off.
Which car insurance company is the cheapest?
As mentioned above, insurance companies that offer the cheapest plans include Geico, Auto-Owners, USAA and Erie.
Does car insurance decrease annually?
For young drivers in particular, car insurance rates decrease each year you renew your policy without filing a claim. You can expect to see the biggest drop in price at age 25.
The average cost of car insurance varies by factors including state, age, insurance company and credit score. Some factors, such as your age, are beyond your control, but other factors, such as your credit score, can be improved.
Check your credit score for free today to see if it’s a reason your car insurance is high.
Situated along the Chesapeake Bay, Maryland is well-known for its scenic beauty, colonial heritage, close proximity to Washington, DC, and a mix of big cities, quaint coastal towns, and welcoming suburbs. If you’re currently living in Maryland or are considering moving to the state, then chances are you have a budget you’d like to stay under when it comes to renting or buying a home. As of August, the median home sale price in Maryland is $431,200.
If that number is out of your budget, don’t worry. We’ve got options to help you find a home. Redfin has collected a list of the 5 most affordable places to live in Maryland. And they all have a median home sale price under the state’s average. From Baltimore to Waldorf, learn what cities are in the top 5.
#1: Baltimore
Median home price: $224,900 Average sale price per square foot: $156 Average rent for a 1-bedroom apartment: $1,349 Median household income: $52,164 Baltimore, MD homes for sale Baltimore, MD apartments for rent
With a median home sale price of $224,900, Baltimore lands the number one spot on our list as the most affordable place to live in Maryland. There are about 585,700 residents living in this city. If you’re considering moving to Baltimore make sure to take a guided tour of Fort McHenry, visit the Walters Art Museum, explore the National Aquarium, hike around Patapsco Valley State Park, or take a boat ride around the Inner Harbor.
#2: Dundalk
Median home price: $225,000 Average sale price per square foot: $177 Average rent for a 1-bedroom apartment: $1,087 Median household income: $55,489 Nearest major metro: Baltimore (9 miles) Dundalk, MD homes for sale Dundalk, MD apartments for rent
Taking second place on our list of affordable cities to live in Maryland is Dundalk, just 9 miles east of Baltimore. When living in this city of 67,800 people, you can take in the picturesque views from one of the waterfront parks.
#3: Bel Air South
Median home price: $340,000 Average sale price per square foot: $185 Median household income: $100,824 Nearest major metro: Baltimore (30 miles) Bel Air South, MD homes for sale Bel Air South, MD apartments for rent
Next is the city of Bel Air South, which has about 57,600 residents. The median home sale price is $340,000 which is about $90K less than the median home sale price in Maryland. If you find yourself moving to the third most affordable place, make sure to visit Harford Glen Park or Winters Run Conservation Area, or check out the nearby Liriodendron Mansion.
#4: Glen Burnie
Median home price: $362,500 Average sale price per square foot: $226 Average rent for a 1-bedroom apartment: $1,522 Median household income: $55,489 Nearest major metro: Baltimore (10 miles) Glen Burnie, MD homes for sale Glen Burnie, MD apartments for rent
Only slightly more expensive than Bel Air South is the city of Glen Burnie. With a population close to 72,900, there’s still plenty to do in Glen Burnie such as checking out one of the parks in town or going shopping.
#5: Waldorf
Median home price: $419,500 Average sale price per square foot: $210 Average rent for a 1-bedroom apartment: $1,950 Median household income: $55,489 Nearest major metro: Alexandria, VA (22 miles) Waldorf, MD homes for sale Waldorf, MD apartments for rent
The final area on our list of affordable places to live in Maryland is Waldorf. With 81,400 residents, moving to this affordable city gives you the perks of city-life without living in a major metropolitan area. Living in Waldorf, you can explore the trails in the nearby Cedarville State Forest or grab a meal at a local restaurant.
Methodology: All cities must have over 50,000 residents per the US Census and have a median home sale price under the average median home sale price in Maryland. Median home sale price and median sale price per square foot from the Redfin Data Center during August 2023. Average rental data from Rent.com August 2023. Population and median household income data sourced from the United States Census Bureau.
It was bound to happen. Just as home builders began to feel more confident about attracting potential buyers, rising mortgage rates are proving too much for those customers.
After steadily rising for seven consecutive months, builder confidence retreated in August as rising mortgage rates nearing 7% (per Freddie Mac) and stubbornly high shelter inflation have further eroded housing affordability and put a damper on consumer demand.
Builder confidence in the market for newly built single-family homes in August fell six points to 50, according to the National Association of Home Builders (NAHB)/Wells Fargo Housing Market Index (HMI) released August 15.
Home Builders Need Workers, Buildable Lots and Distribution Transformers
“Rising mortgage rates and high construction costs stemming from a dearth of construction workers, a lack of buildable lots and ongoing shortages of distribution transformers put a chill on builder sentiment in August,” said NAHB Chairman Alicia Huey, a custom home builder and developer from Birmingham, Ala.
Huey said that other factors are helping support the demand for new construction.
“But while this latest confidence reading is a reminder that housing affordability is an ongoing challenge, demand for new construction continues to be supported by a lack of resale inventory, as many homeowners elect to stay put because they are locked in at a low mortgage rate.”
Housing Affordability Compared to US Median Income
Rising home prices and interest rates coupled with elevated construction costs, low existing inventory and solid demand resulted in a significant decline in housing affordability during the second quarter of 2023.
According to the NAHB/Wells Fargo Housing Opportunity Index (HOI), 40.5% of new and existing homes sold between the beginning of April and end of June were affordable to families earning the U.S. median income of $96,300. This is down from 45.6% posted in the first quarter of this year, and the second-lowest reading since NAHB began tracking affordability on a consistent basis in 2012.
Where to Buy? Affordable Housing Markets Around the Country
The Housing Opportunity Index shows that the national median home price increased to $388,000 in the second quarter, up from $365,000 in the previous quarter. Meanwhile, average mortgage rates rose from 6.46% to 6.59% during this period.
The top five most affordable major housing markets in the second quarter of 2023 were:
Lansing-East Lansing, Mich.
Scranton-Wilkes-Barre, Pa.
Harrisburg-Carlisle, Pa.
Indianapolis-Carmel-Anderson, Ind.
Pittsburgh, Pa.
Top five least affordable major housing markets—all located in California:
Los Angeles-Long Beach-Glendale
Anaheim-Santa Ana-Irvine
San Diego-Chula Vista-Carlsbad
Oxnard-Thousand Oaks-Ventura
San Francisco-San Mateo-Redwood City
Meanwhile, Cumberland, Md.-W.Va., was rated the nation’s most affordable small market, with 95.5% of homes sold in the second quarter being affordable to families earning the median income of $89,900.
The top five least affordable small housing markets were also in the Golden State. Tied at the very bottom of the affordability chart were Salinas, Calif., and San Luis Obispo-Paso Robles, Calif., where 6.5% of all new and existing homes sold in the second quarter were affordable to families earning the area median income of $100,400 in Salinas and $113,100 in San Luis-Obispo-Paso Robles.
NAHB Chief Economist Robert Deitz Calls for Government Action
Deitz said that government policies aimed at helping builders could help the housing shortfall. He said the shortfall is currently about 1.5 million housing units.
“Declining customer traffic is a reminder of the larger challenge that shelter inflation is up 7.7% from a year ago and accounted for a striking 90% of the July Consumer Price Index reading of 3.2%,” said NAHB Chief Economist Robert Dietz. “The best way to bring housing inflation down and ease the housing affordability crisis is to enact policies at all levels of government that will allow builders to construct more homes to address a nationwide shortfall of approximately 1.5 million housing units.”
Builders Again Pressed Into Using Sales Incentives
The August HMI survey also revealed that rising mortgage rates are causing more builders to use sales incentives to attract home buyers.
After dropping steadily for four months (from 31% in March to 22% in July), the share of builders cutting prices to bolster sales rose again to 25% in August.
The average decline for builders reducing prices remained at 6%. And the share of builders using incentives to bolster sales was 55% in August, higher than in July (52%) but still lower than in December 2022 (62%).
Buying a home is a significant milestone filled with excitement and anticipation. However, the process can also be intricate and overwhelming, especially when it comes to understanding the nuances of home inspections.
If you’re looking to buy a home in Baltimore, MD, the significance of a comprehensive home inspection cannot be overstated. A thorough home inspection not only provides valuable insights into the condition of a property but also offers peace of mind, so you can make informed decisions. In this Redfin article, we will delve into the importance of getting a home inspection in Maryland. Plus, we’ve got insights straight from local home inspection experts who’ll be sharing their best advice on the subject. Let’s get started.
Why should you get a home inspection in Maryland?
A house is likely the most expensive purchase of your life, and getting an inspection is the only way to ensure that you are making a sound investment.
“A home inspection is crucial and valuable for many reasons,” says Austin Callahan of Callahan Inspection Services. “Not only will it allow you to fully discover the issues your home may have, but it can also uncover some serious safety hazards that may affect you and/or your loved ones. A home inspector can also let you know what kind of things require routine maintenance to extend the life and efficiency of the systems in your home.”
“A home inspection should be a requirement for the future homeowner’s protection,” says Chris Lord, owner of Invision Home Inspections. “Invest a couple of hundred dollars now to protect thousands in the future. You are buying peace of mind and sometimes training if you participate in the inspection.”
Are there any specialized inspections that Maryland buyers should consider?
“Lead paint is common in Maryland, especially in homes built before the 1950s,” says Matthew Schelberg of Shell Home Inspections. “Builders would often use paint from the shipyards. If a buyer expects to have young children in the home, it’s a good idea to consider a lead paint inspection. This can tell you what components have lead paint, so you can take proper measures during future renovations.”
In addition to testing for lead paint, Dimitrios Bitsanis of OBSERVE Home Inspections recommends inspections for radon and termites.
Are home inspections required in Maryland?
“It is not required to get a home inspection in Maryland, but some lenders may require it,” according to Patrick and Natasha Hammond of 360 Home Inspections. “A home inspection is highly recommended for the buyer to ensure that you are purchasing a property you are comfortable with and is not going to put you in financial distress, whether it is a pre-existing home or a new build.”
How much does a home inspection cost in Maryland?
“The cost of a home inspection typically varies based on the type and size of the home, foundation type, and age,” says John Stavlas of Stavlas Home Inspections. “Plan to spend $350-$400 for a condo and $450-$600 for a single-family detached home.”
Can you sell a house in Maryland without an inspection?
Yes, you can sell a house in Maryland without a home inspection. However, many buyers in Maryland opt to have one as part of their due diligence process to ensure they’re making an informed decision about the condition of the property.
Scott Donnelly of High Tech Inspections, Inc. adds, “Sellers do not need a pre-sale inspection in Maryland. However, having a pre-sale inspection allows you to address any major issues that may scare away a buyer. A thorough inspection report you can share with buyers may also help them feel more at ease and perhaps opt not to have their own independent inspection.”
Expert advice for Maryland buyers before they get a home inspection
“A good home inspection can be so thorough that you get cold feet when you review it,” says Daniel Sperling-Horowitz, CEO of OfferMarket. “That’s why we recommend reviewing the home inspection report with your real estate agent and a trusted contractor. We also encourage you to call the home inspector to go over any concerns. In a buyer’s market, the home inspection can also serve as leverage to request seller concessions to address legitimate concerns in the inspection report.”
For those who are unsure whether a full inspection is necessary, an inspector can do a basic walk-through of a home to identify any major red flags. “A walk-through is simply a one to two-hour visit to the property with the inspector, the client, and their agent,” says Neil Summers of Neil Summers Home Inspections. “This may be the only time the buyer can see the home through an inspector’s eyes before committing to purchase.” Summers stresses that even with a walk-through, buyers should always get a full home inspection.
Maryland home inspections: the bottom line
Buying a home is one of the biggest life decisions you can make. Before you finalize the purchase of your dream home, a Maryland home inspection will give you peace of mind before buying.