The idea of a four-day workweek is so popular with some workers that they’d be willing to take a pay cut to make it happen, according to a new survey.
The survey, which included 1,250 people who work full time, was conducted in April by Resume Builder, a career services company. It found that 8 in 10 workers would be excited to work 32 hours a week instead of 40 because they believe it would help them achieve better work-life balance, improve their health, mitigate burnout, be more productive and reduce commuting costs.
The survey results suggest some workers feel pretty desperate for that better work experience. Even though nearly all the survey participants (94%) said they could do the same amount of work in fewer hours, about 21% said they would take a pay cut if it meant they could work the equivalent of one less day per week.
In addition, 83% of respondents said they would prefer a four-day, 40-hour workweek to the current standard of 40 hours in five days.
“I think people value time now more than they ever have — especially younger generations,” says Julia Toothacre, resume and career strategist with Resume Builder.
Idea of a four-day workweek is catching on
The four-day workweek is still a long way from becoming the norm in the U.S., Toothacre says. But the idea has picked up steam in recent years because it’s seen as a way to address the impact of work stress and long hours.
Roughly 3 out of 4 workers said they experienced work-related stress in the last month, according to the 2023 Work in America Survey by the American Psychological Association. More than half said that stress resulted in an array of negative effects, including emotional exhaustion, lack of motivation, a desire to quit, lower productivity and irritability.
There’s some interest in making the four-day workweek a national policy. In March, Sen. Bernie Sanders, I-Vt., introduced a bill that would standardize a 32-hour workweek without cutting workers’ pay or benefits. But it’s not expected to go anywhere.
Pilot programs show promising results
Instead, the four-day workweek has gained the most traction through companies’ participation in pilot programs. Organizations around the world have tested it out, and the results are pretty positive. In 2022, a pilot program that included 33 U.S. companies found that most of them wanted to continue with the 32-hour schedule after the trial period ended.
The companies involved in this pilot didn’t make any changes to workers’ pay. And it turns out that’s for good reason: The companies reported that productivity was positively affected by the new schedule. Workers at the participating companies said their job performance improved during the course of the trial.
In the trial, companies got rid of meetings and other unnecessary activities to free up workers’ time, according to Boston College researchers who evaluated the results. Wen Fan, a sociology professor, said in a December 2022 news release that the program worked as expected. “Hours reduced, well-being improved, and key organizational bottom-lines sustained — all of these happened without the need for workers to intensify their work demands.”
Vermont’s scenic landscapes blend seamlessly with the urban sophistication found in its cities, creating an inviting atmosphere for renters. Vermont offers a unique living experience, where the beauty of nature meets the convenience of urban living, making it an ideal destination for those looking to call the Green Mountain State home. From the charming streets of Burlington to the small town of Montpelier, this ApartmentGuide article will highlight the pros and cons of living in Vermont.
Renting in Vermont snapshot
1. Pro: Vibrant outdoor activities
Vermont’s landscape is a playground for outdoor enthusiasts, offering a plethora of activities from skiing and snowboarding in the Green Mountains to hiking the Long Trail. The state’s natural beauty, including the serene Lake Champlain, provides a perfect backdrop for adventure and relaxation.
2. Con: harsh winters
Vermont is known for its brutally cold winters that can present challenges for residents. The heavy snowfall and below-freezing temperatures in the winter months can make daily commutes difficult and increase heating costs significantly.
3. Pro: Tight-knit community
In Vermont, there’s a strong emphasis on community and localism. Farmers’ markets, community events, and local festivals are commonplace, fostering a close-knit environment where neighbors support each other. This sense of community is especially palpable in towns like Essex Junction.
4. Con: Limited nightlife and entertainment options
Compared to larger states like neighboring Massachusetts and New York, Vermont offers fewer options for nightlife and entertainment, particularly in its smaller towns and rural areas like Wilder. While Burlington boasts a more vibrant scene, other parts of the state may lack variety for those seeking extensive nightlife activities.
5. Pro: Environmental leadership
Vermont is a leader in environmental conservation and sustainability, boasting extensive green spaces, parks, and a commitment to renewable energy. The state’s efforts to preserve its natural resources and promote sustainability can be seen in its policies and community initiatives, such as the Vermont Clean Energy Development Fund, which supports renewable energy projects statewide, and the Vermont Land Trust, which conserves thousands of acres of land for public use and ecological preservation.
6. Con: Higher cost of living
Despite its many attractions, Vermont has a higher cost of living compared to the national average. This is reflected in its housing, healthcare, and general expenses. Residents may find themselves spending more on daily necessities than they would in other states. In popular metros like Burlington, the average rental price for a one-bedroom is $1,800, which can be a significant expense for those looking for housing options.
7. Pro: Quality local foods
Vermont is famous for its quality local foods, including maple syrup, cheese, and craft beer. The state’s focus on farm-to-table dining means residents and visitors can enjoy fresh, locally-sourced ingredients at restaurants and markets throughout the state. In fact, if you’re craving something sweet, you should try a scoop of Ben & Jerry’s ice cream, which was founded in Burlington.
8. Con: Limited public transportation
Public transportation options in Vermont are limited, especially in rural areas. This can make it challenging for those without personal vehicles to navigate the state, particularly during the winter months when weather conditions can disrupt travel. Even in larger cities like Burlington, the transit score is 39, making it a car-dependent location.
9. Pro: Fall foilage
Vermont’s stunning fall foliage is a major draw, as the state’s landscape transforms into a vibrant tapestry of reds, oranges, and yellows during the autumn months. Iconic locations such as the scenic Route 100, the quaint town of Stowe, and the picturesque shores of Lake Champlain offer breathtaking views of Vermont’s foliage at its peak.
10. Con: Small economy
The state’s economy is relatively small, which can limit job opportunities in certain sectors. While Vermont has a thriving agricultural and tourism industry, those seeking careers in more diverse fields may find fewer options compared to larger states.
11. Pro: Health-conscious community
Vermont’s residents place a high value on health and wellness, contributing to the state’s reputation as one of the healthiest in the country. This is supported by a wide range of outdoor activities, health food stores, and community wellness programs. Additionally, Vermont’s commitment to organic farming and sustainable agriculture ensures access to fresh, locally sourced produce.
12. Con: Rural isolation
Some may find Vermont’s rural character and small-town feel isolating, especially those accustomed to the hustle and bustle of larger cities. The state’s tranquil setting and slower pace of life, while appealing to many, may not suit everyone’s social and professional needs.
Methodology : The population data is from the United States Census Bureau, walkable cities are from Walk Score, and rental data is from ApartmentGuide.
Turn your passion for playing video games into a career by attending one of the top game design colleges in the country.
Game design is an in-demand industry, with new video games for gaming systems, tablets, and phones continually being developed and released. Here, we’re exploring 20 of the best gaming development programs you might want to consider.
What to Look for in a Game Design School
If you’re looking into colleges for video game design, you’ll quickly realize that not all programs are created equally. Some schools only offer a class or two in game design, while others go deep into the field, offering internships and hands-on experiences.
If you’re interested in attending a game design school, it’s important to research schools and programs prior to making your decision. Make sure to look into the specific type of degree you want (undergraduate degree or certificate, for example), the length and commitment of the program, what current and former students have to say about the program, the helpfulness of the faculty and staff, and more.
Luckily, we’ve done the work for you and have narrowed down the top colleges offering game design programs.
The Top 20 Best Colleges for Game Design
There are several video game design colleges and programs in the United States. Here, we’ve created a list starting with the most affordable game design colleges all the way up to those with higher tuition expenses.
1. Shawnee State University
Shawnee’s Game Design School has made it on The Princeton Review’s Top Undergraduate Schools for Game Design list for 13 consecutive years, and with such low tuition, it might be a great bargain. Located in Portsmouth, OH, you can elect to study Game Programming or Game & Simulation Arts.
• 1 year of tuition: In-state $9,621.52; Out-of-state $16,156
2. University of Silicon Valley
USV is available on-campus in the heart of Silicon Valley or 100% online. The university offers Bachelor of Arts degrees in both Game Design and Game Art, as well as a Bachelor of Science in Game Engineering. After graduating, students are qualified for roles including animator, modeler, game writer, computer programmer, and more.
• 1 year of tuition: $27,850 for both in-state and out-of-state students
3. Arizona State University
ASU’s Bachelor of Arts in Interdisciplinary Studies offers a concentration in Computer Gaming with three tracks to choose from: Programming, Art, or Education. Located in stunning Tempe, AZ, courses in the program include Introduction to Graphics and Game Development, Fundamentals of Game Art, Game Engine Architecture, and 3D Modeling and Texturing.
• 1 year of tuition: In-state $12,051; Out-of-state $32,193
4. University of Utah
The Utah Division of Games, located in Salt Lake City, is a college for game designing that combines art, humanities, social science, and computational research and practice to prepare students for careers in the field. Students can choose from multiple gaming bachelor’s degrees, a master’s degree, and even a minor in gaming. The Bachelor of Science in Games includes courses like Survey of Games, Ethics in Games, and Alternative Game Development.
• 1 year of tuition: In-state $9400; Out-of-state $31,104 💡 Quick Tip: Fund your education with a low-rate, no-fee SoFi private student loan that covers all school-certified costs.
5. University of Southern California
USC’s Interactive Media & Games program offers three undergraduate options: a BFA in Themed Entertainment, a BFA in Game Development and Interaction, and a BFA in Game Art. Located in sunny Los Angeles, the program also offers four graduate degrees and nine minors.
• 1 year of tuition: $33,320 for both in-state and out-of-state students
6. Laguna College of Art and Design
Laguna College of Art and Design Game Art program, located in Laguna Beach, CA, prepares students for employment in any studio or software environment. Students learn the fundamentals of storytelling at every phase of the creation process, how to use a workflow methodology, and how to solve problems in concept challenges.
• 1 year of tuition: $37,500 for both in-state and out-of-state students
7. Full Sail University
Full Sail’s Interactive Technology Bachelor of Science Completion Program in Winter Park, FL offers a Game Design concentration that includes high-level game design and production courses that prepare students to work in game studios after graduation. Recognized as a Top Game Designs Schools by The Princeton Review, the program offers multiple start dates throughout the year and has an accelerated schedule for students looking to finish early.
• 1 year of tuition: $38,750 for both in-state and out-of-state students
8. Drexel University
Drexel University in Philadelphia offers a Bachelor of Science in Game Design & Production, and is recognized as one of the country’s top undergraduate game design programs. Students learn skills like scripting and storytelling, computer programming, computer graphics, animation, motion capture, and more.
• 1 year of tuition: $38,862 for both in-state and out-of-state students
9. Bradley University
Bradley University in Peoria, IL offers both a BA and a BS in Game Design. During your studies, you’ll have the opportunity to intern for a design company, participate in competitions, and show your work at an annual exhibit.
• 1 year of tuition: $39,248 for both in-state and out-of-state students
10. Savannah College of Art and Design
SCAD’s Interactive Design and Game Development degrees offer locations in Atlanta and Savannah, GA with the option to study abroad in Lacoste, France. Students can study at any of the three locations each semester, with the option to switch locations during their time in the program. Courses in the program include Digital Communication, Visual Culture in Context: Pre-Modern Global Perspectives, Aesthetics, and Core Principles: Game Art.
• 1 year of tuition: $41,130 for both in-state and out-of-state students
11. Michigan State University
MSU offers a Game Design and Development Program, a Top 10 Ranked program by The Princeton Review, that was founded in 2005. Students can choose from a Bachelor of Arts in Games and Interactive Media, a Minor in Game Design and Development, or a Serious Games Graduate Certificate. All students get the opportunity to design prototypes and conduct research on the effects of gaming.
• 1 year of tuition: In-state $16,051; Out-of-state $43,435
Recommended: How to Complete the FAFSA Application
12. University of California – Irvine
The Bachelor of Science degree in Game Design & Interactive Media at UC Irvine includes coursework in game programming, game design and development, visual design, interactive storytelling, data science, and game studies. Students graduate the program well-prepared for a career as a designer, developer, and industry leader. Students also get access to well-respected industry mentors.
• 1 year of tuition: In-state $17.205.74; Out-of-state $32,574
13. Champlain College
Champlain’s Bachelor of Science in Game Programming provides hands-on experience, with students collaborating to create and complete game projects. Located in gorgeous Burlington, VT, Champlain was named a “Most Innovative School” by U.S. News & World Report in 2022. Upon graduation, students are well-prepared to work in gaming studios.
• 1 year of tuition: $47,400
14. Quinnipiac University
Level up your creativity with Quinnipiac University’s Game Design & Development Program. Ranked as one of The Princeton Review’s Top Game Design Programs, students can choose a concentration to focus on, including programming, technology, design process, art, game studies, and more. Located in Hamden, CT, the program also gives students the chance to collaborate with partners both within and outside the community.
• 1 year of tuition: $50,400
Recommended: Financial Benefits of Community College
15. Rochester Institute of Technology
The Game Design, Development, and Arts program at RIT has been rated one of the best programs in this field of study by many organizations, including U.S. News & World Report. Degree options include 3D Digital Design, Film & Animation, Illustration, New Media Interactive Development, and more.
• 1 year of tuition: $56,136 💡 Quick Tip: Need a private student loan to cover your school bills? Because approval for a private student loan is based on creditworthiness, a cosigner may help a student get loan approval and a lower rate.
16. Worcester Polytechnic Institute
The Interactive Media and Game Development (IMGD) program at WPI dives into different aspects of gaming design, including digital painting, 3D modeling, writing for games, game audio, artificial intelligence, and virtual reality. Located in Worcester, MA, the program is recognized as one of the oldest gaming programs in the country.
• 1 year of tuition: $57,960
17. New York University
New York University’s BFA in Game Design has three primary areas of study: Game Studies, Game Design, and Game Development. You can also choose from one the following Production Areas: Programming, Video Design, Audio Design, and Game Business. Though tuition here is a bit higher than at some of the other schools, you can pay for it with a federal or private student loan.
• 1 year of tuition: $60,438
18. Carnegie Mellon
The Game Design undergraduate program at Carnegie Mellon in Pittsburgh, PA will give you a solid foundation in game systems and mechanics design, interactive narrative and character development, visual and audio asset creation, game programming, interface design and user testing, and collaboration and the iterative design process.
• 1 year of tuition: $62,260
19. University of California – Santa Cruz
In USC Santa Cruz’s Bachelor of Science in Computer Science: Computer Game Design, you’ll learn about the construction and design of interactive computer games. In your final year of study, you’ll be immersed in an intensive year-long game project sequence.
• 1 year of tuition: In-state: $30,567; Out-of-state: $65,148
Recommended: Student Debt Guide
20. Cornell University
Cornell, another of the best game design colleges located in Ithaca, NY, offers a minor in Game Design that includes classes like Intro to Computer Game Architecture, Advanced Computer Game Architecture, Analytics-Driven Game Design, Graphics and Art, the Psychology of Gaming, and Human-Computer Interaction.
• 1 year of tuition: $65,204
The Takeaway
With so many game design colleges available, it might be hard to make a decision. Factors to keep in mind include the type of program, the location, the faculty and staff, and the cost.
However, don’t let cost deter you from going to the school of your choice. To pay for school, you can look into federal student loans, scholarships, and grants.
If you’ve exhausted all federal student aid options, no-fee private student loans from SoFi can help you pay for school. The online application process is easy, and you can see rates and terms in just minutes. Repayment plans are flexible, so you can find an option that works for your financial plan and budget.
Cover up to 100% of school-certified costs including tuition, books, supplies, room and board, and transportation with a private student loan from SoFi.
FAQ
What’s the most affordable game design program?
Shawnee State University offers a nationally acclaimed game design program with low tuition. Tuition for in-state residents is $16,156 per year.
What’s the most expensive game design program?
Cornell University has one of the most expensive game design programs in the U.S. at over $65,000 per year.
How much does game design school cost?
Game design schools can range from $16,000 per year all the way up to more than $65,000 per year.
Photo credit: iStock/fizkes
SoFi Private Student Loans Please borrow responsibly. SoFi Private Student Loans are not a substitute for federal loans, grants, and work-study programs. You should exhaust all your federal student aid options before you consider any private loans, including ours. Read our FAQs.
SoFi Private Student Loans are subject to program terms and restrictions, and applicants must meet SoFi’s eligibility and underwriting requirements. See SoFi.com/eligibility-criteria for more information. To view payment examples, click here. SoFi reserves the right to modify eligibility criteria at any time. This information is subject to change.
Financial Tips & Strategies: The tips provided on this website are of a general nature and do not take into account your specific objectives, financial situation, and needs. You should always consider their appropriateness given your own circumstances.
External Websites: The information and analysis provided through hyperlinks to third-party websites, while believed to be accurate, cannot be guaranteed by SoFi. Links are provided for informational purposes and should not be viewed as an endorsement.
Non affiliation: SoFi isn’t affiliated with any of the companies highlighted in this article.
Third-Party Brand Mentions: No brands, products, or companies mentioned are affiliated with SoFi, nor do they endorse or sponsor this article. Third-party trademarks referenced herein are property of their respective owners.
While the economy continues to expand and added 2.7 million jobs in 2023, signs point to a normalization in the labor market as job growth is expected to moderate in 2024. MORE
While mortgage rates have moved sideways since mid-December, housing continues to be impacted by higher mortgage rates with total home sales on track to be the lowest since 2012. MORE
Facing higher borrowing costs, borrowers are paying more discount points to buy down their mortgage rate, but they may not be getting the benefit. MORE
Recent developments
U.S. economy: According to the latest estimate of U.S. economic growth for Q3 2023, the economy grew at a seasonally adjusted annualized rate (SAAR) of 4.9%, slightly slower than the second estimate but still the fastest since Q4 2021— and among the fastest growth in the last 20 years. Consumption spending growth was revised down from a SAAR of 3.6% in the second estimate to 3.1% in the final estimate. This was mainly led by a decline in spending on services but remained the largest contributor to growth at 2.1 percentage points. After nine consecutive quarters of negative growth, residential investment growth came in much stronger than the initial estimates at a SAAR of 6.7%.
The labor market remained much stronger than expected in 2023 and defied expectations of a slowdown. The economy added 216,000 jobs in December, bringing the total jobs added in 2023 to 2.7 million.1 While total jobs added in 2023 was lower than the historical highs of 2021 and 2022, job growth was still remarkable given the high interest rate environment the economy faced. The unemployment rate remained unchanged in December at 3.7% compared to November 2023, but moved up 0.3 percentage points over the year.
While job growth remained significant over the year, some indications of a softer labor market are starting to creep in. The labor force participation rate as well as employment to population ratio decreased 0.3 percentage points over the month to 62.5% and 60.1% respectively. Downward revisions to October and November job growth meant the 3-month average job gain in the fourth quarter of 2023 was the lowest since the third quarter of 2019, if we exclude the 2020 recession. However, the torrid pace of job growth was unlikely to be sustained and employment growth is approaching levels consistent with a balanced labor market. Heading into 2024, we might see a moderation in job growth, which would be more consistent with long-run growth in the U.S. labor force. Job openings edged down slightly to 8.8 million in November 2023, according to the Bureau of Labor Statistics (BLS) Job Openings and Labor Turnover Survey. The ratio of job openings to unemployed, a metric that the Federal Reserve has been tracking to gauge the strength of the labor market, declined from a high of around 1.8 in January 2023 to 1.4 in November.
Inflation continues to trend towards the Federal Reserve’s target rate of 2%. The preferred measure of inflation of the Federal Reserve, the Core Personal Consumption Expenditure (PCE) measure increased at a rate of 3.2% year over year, the smallest annual increase since May 2021.2 While inflation has been moderating as the labor market normalizes, a reacceleration of home prices along with still high average hourly earnings growth at 4.1% year over year, could mean that getting to the 2% target might take longer than expected.
U.S. housing market: The housing market felt the impact of higher rates in 2023 with total annual home sales on track to be the lowest since 2012. Total (existing and new) home sales reached 4.4 million units in November 2023, down 1.2% as compared to October 2023 and 6.2% below November 2022. Total home sales averaged around 4.8 million from January through November 2023. Existing home sales were at 3.8 million as of November 2023 and averaged 4.1 million through November 2023.3 The existing housing inventory grew 15.3% year to date in November but the level of inventory (1.1 million homes available for sale in November) remains extremely low by historical standards.4 The rate-lock effect, which was the main driver of the lack of existing inventory, continued to push buyers towards the new home market. The number of new homes available for sale increased 2.7% year-to-date and was up 2.5% from the previous month. Overall, the sales of new homes averaged 666,000 in 2023 as compared to 637,000 in 2022.5
Falling interest rates have spurred the confidence of both potential homebuyers as well as the homebuilders. The Housing Market Index, which had decreased since August increased in December 2023. While existing home sales increased in November, pending home sales for November were still weak and saw a 5.2% decrease from the previous year. The FHFA Purchase-Only Home Price Index indicated that as of October of 2023, home prices rose 6.1% year to date, and as more home buyers enter the market amidst the lack of inventory, the pressure on prices could increase further.
U.S. mortgage market: Mortgage rates were on an upward trajectory for most of 2023, reaching 23-year highs in October. However, since the last week of October, rates have been declining mainly on the expectation of rate cuts by the Federal Reserve along with easing inflationary pressures. The average 30-year fixed-rate mortgage, as measured by Freddie Mac’s Primary Mortgage Market Survey® (PMMS®), fell almost one percentage point from the last week in October through mid-December. Despite the decline in recent weeks, mortgage rates are 13 basis points higher than they were at the beginning of the year. Mortgage activity also declined with purchase applications down almost 12% in 2023 and total applications down 7% even as refinance applications increased 15% over the year.6
Tighter financial conditions and higher overall interest rates are starting to impact mortgage delinquency rates. Total mortgage delinquency rates were up 0.25 percentage points from 3.37% in Q2 2023 to 3.62% in Q3 2023 according to the MBA’s National Delinquency Survey. The delinquency rate on conventional mortgages increased from 2.29% to 2.5% in Q3 2023 while the delinquency rate of VA loans was up from 3.7% to 3.76% over the same period. The largest increase was in the delinquency rate of FHA loans which increased 0.55 percentage points from 8.95% in Q2 to 9.5% in Q3. Interestingly, serious delinquency rates (90+ DQs) went down across the board between Q2 and Q3. Foreclosure starts increased from 0.13% in Q2 to 0.19% in Q3 2023 but remain low compared to its historical average.
Outlook
The U.S. economy exhibited tremendous resilience last year on strong consumer spending. We expect economic growth to slow this year as consumer spending starts to fade. Under our baseline scenario, with a slowing economy, the unemployment rate will see a modest uptick, and inflation will continue to moderate.
With inflation remaining above the Federal Reserve’s target rate of 2%, we do not expect the Federal Reserve to start cutting the federal fund rates immediately. However, it will continue to pause on interest rate hikes. We expect rate cuts in the second half of the year if the job market cools off enough to keep inflation muted. Under this scenario, we expect mortgage rates to ease throughout the year while remaining in the 6% range.
Falling rates will breathe some life into the housing market with some recovery in home sales. However, home sales are expected to grow only modestly due to a lack of inventory in the market. The demand for housing, however, will remain high based on a large share of Millennial first-time homebuyers looking to buy homes, which will push home prices up. We forecast home prices to increase 2.8% in 2024 and 2.0% in 2025 nationally.
Under our baseline scenario, we expect increases in both purchase and refinance volumes this year and into 2025. On purchase originations, higher home sales and growth in home prices will drive the dollar volumes of purchase originations up. However, we do not expect purchase origination volumes to reach the levels seen in 2021 and 2022 as lack of inventory will limit home sales. The drop in mortgage rates will push refinance originations up, as buyers who obtained higher interest rates in 2023 will likely refinance into lower rates. However, rates remaining around the 6% range will not provide enough refinance incentives to millions of homeowners who currently have rates below 6%. And therefore, we expect refinance volume to grow only modestly this year. Overall, we forecast total origination volumes to improve this year and into the next.
January 2024 SPOTLIGHT:
Declining affordability led borrowers to pay more discount points to buy down rates, but our research suggests it may not be worth it
Mortgage rates, as measured by Freddie Mac’s PMMS®, increased significantly in 2023 compared to the record lows of the past few years. On October 26, 2023, the average 30-year fixed-rate mortgage stood at 7.79%, a 23-year high. Since then, mortgage rates have moderated, but remain high by recent historical standards. These higher mortgage rates led many borrowers to make the decision to pay points in order to lower the rate when purchasing a house or refinancing an existing mortgage. During the low interest rate environment, few borrowers opted to pay discount points when obtaining a mortgage, but as rates started creeping up in the early 2022, we saw more borrowers paying discount points to lower their rate.
Using Freddie Mac closing data, we examined how often borrowers pay discount points and how many points they pay. For this analysis, the points we are focusing on are for permanent interest rate reductions throughout the life of the loan.7 To that end, we looked at a borrower profile that roughly matches our PMMS® population: mortgage for a home purchase or refinance of a one-unit, single-family owner-occupied property with a fully amortizing 30-year fixed-rate mortgage. We further restricted our sample to borrowers with conforming loans, and with credit scores 740 or above and a loan-to-value (LTV) ratio between 75 and 80 (inclusive).
We found that the share of borrowers who paid discount points increased in 2023 (Exhibit 1). For example, about 58.8% of purchase mortgage borrowers paid discount points in 2023, compared to 31.3% and 53.6% of purchase borrowers in 2021 and 2022 respectively. The share paying discount points was higher for noncash- out and cash-out refinance borrowers, 59.9% and 82.4%, respectively. Also, conditional on paying points, refinance borrowers tended to pay much higher points: 0.99 points for purchase borrowers compared to 1.16 and 1.76 points for non-cash-out and cash-out refinance borrowers, respectively.
It is interesting to note, however, that the interest rate differential between borrowers who pay discount points and those who do not pay discount points is very small. Through November 2023, the average effective rate on purchase loans for borrowers who did not pay discount points was 6.69% versus 6.86% for those who did pay points. This result seems to suggest that paying discount points may not be worth it from the consumers’ point of view. Indeed, some academic research8 has shown that in many circumstances paying discount points can be a poor financial decision. However, while our tabulation shows that borrowers who do not pay points generally receive lower mortgage rates compared to similar borrowers who do pay points, we do not control completely for borrower observed and unobserved attributes. Therefore, we cannot say with certainty that for any particular borrower, the relationship between discount points paid and interest rate is negative.9
Enlarge Image
Exhibit 2 compares the quarterly average discount points paid by Freddie Mac borrowers (home purchase, owner occupied, one-unit properties). From 2018 through 2021, borrowers that matched the PMMS® profile, (borrowers with origination LTV between 75 and 80 and FICO score 740 or higher) paid about the same average amount of points compared to all purchase borrowers. Starting in 2022 and continuing through 2023, higher credit quality borrowers tended to pay fewer points compared to all borrowers. In 2023, borrowers that matched the PMMS® profile paid on average about 0.06 less points or about 10% less compared to all purchase borrowers.
Enlarge Image
Prime borrowers who pay discount points on average have higher incomes and are obtaining higher loan balances when purchasing a home compared to borrowers who do not pay points. For example, in 2023 the average loan amount for purchase loans with points paid at origination was $360,000, compared with an average loan amount of $370,000 for mortgages where the borrowers did not pay points. In 2023, the average annual income of a “no discount points” borrower was $148,000, higher than the $140,000 average annual income for borrowers who paid points.
Our analysis on the closing files data shows that there is a difference in borrower behavior across the U.S. when it comes to paying discount points and origination fees. For example, in 2023 over 70% of prime purchase borrowers in HI, NM, WV, OR, WA, and DE paid discount points when closing on their mortgage while less than 50% of borrowers paid discount points in VT, IA, MA, IL, NE, ND, and WI. Exhibit 3 below shows the breakdown by state in 2023.
Enlarge Image
Our analysis shows that mortgage borrowers in 2023 were more willing to pay discount points than in previous years, and that the likelihood of paying points was greater for lower credit quality borrowers compared to the high-quality mortgage borrowers captured in our PMMS® profile population. We also saw that borrowers in the Midwest were less likely to pay points compared to borrowers in the Pacific and Mountain West. If interest rates stabilize in 2024, it will be interesting to observe whether borrowers opt to pay fewer points, or if the recent uptick in paying discount points is a more permanent shift in the mortgage market.
Footnotes
1 Non-Farm Employment, Bureau of Labor Statistics
2 BEA
3 National Association of Realtors (NAR)
4 From January 1999 through December 2019 the average number of existing homes available for sale averaged 2.2 million, about double the number of homes available for sale in November 2023.
5 U.S. Census Bureau and U.S. Department of Housing and Urban Development
6 Mortgage Bankers Association (MBA)
7 For an analysis of temporary buydowns see our previous Research Brief: https://www.freddiemac.com/research/insight/20230731-temporary-mortgage-rate-buydown-activity-spiked-in.
8 See for example: Agarwal, S., Ben-David, I. and Yao, V., 2017. Systematic mistakes in the mortgage market and lack of financial sophistication. Journal of Financial Economics, 123(1), pp. 42-58.
9 For a more detailed analysis see: Mota, N., Palim, M. and Woodward, S., 2022. Mortgages are still confusing… and it matters—How borrower attributes and mortgage shopping behavior impact costs. Fannie Mae Working Paper. https://www.fanniemae.com/media/45841/display
November home sales dropped from October levels, posting the lowest median sales price in eight months, according to the RE/MAX National Housing Report for November 2023. The report revealed the number of homes for sale also fell slightly.
Indicative of the usual year-end slowdown, home sales in November dropped by 9.8% compared to October and declined 6.5% versus the same period last year. This decline can also be attributed to rising interest rates most of this year and last. Interest rates have decreased over the last two months, which could result in more activity in the market.
The number of homes for sale changed slightly – dropping 1.6% from October and declining 2.6% compared to November 2022.
Across the 52 metro areas surveyed, homes sold for a median price of $405,000, which was $5,000 less than in October but $13,000 higher than in November 2022. New listings, though up 1.5% year over year, were down 19.1% from October.
Key Findings:
Homes sold were on the market an average of 40 days–four days longer than in October and one day more than in November 2022.
Homes sold in November for an average of 99% of the listing price–the same as in October and up from 98% in November 2022.
Months’ supply of inventory in November was 2.6, larger than 2.3 in October and 2.5 in November 2022.
“Although November results are in line with trends we’ve seen this year, there’s reason to think 2024 could be more active, especially with prices and interest rates coming down a bit recently,” said Nick Bailey, President and CEO of RE/MAX, LLC. “When we look at the national picture, it’s a collection of local snapshots, each with different conditions. As the report shows, new listings in a few markets, including Omaha and Orlando, were up more than 25% year over year, while they decreased in others. So, while the results tell an overall story, the key for homebuyers and sellers is to work with a local real estate agent who can speak to the unique local conditions.”
Steve Silcock, Broker/Owner of RE/MAX Heritage in Clermont, FL, said, “November inventory in the Orlando area increased for the sixth month in a row to bump up months’ supply to a level not seen since January 2019. But we are still well below what many consider to be a balanced market, and median home prices are down slightly. However, December activity to date looks promising, especially in our retirement markets, and considering the recent drop in interest rates and the change in tone from the Federal Reserve, we are really looking forward to what we hope will be a strong and exciting 2024.”
New Listings
Of the 52 metro areas surveyed in November 2023, the number of newly listed homes was down 19.1% compared to October 2023 and up 1.5% compared to November 2022. The markets with the biggest decrease in year-over-year new listing percentage were Anchorage, AK, at -20.3%, Birmingham, AL, at -12.7%, and Honolulu at -11.5%. The markets with the biggest year-over-year increase in new listings percentage were Omaha, NE, at +33.2%, Burlington, VT, at +25.9%, and Orlando, FL, at +25.2%.
Closed Transactions
Of the 52 metro areas surveyed in November 2023, the overall number of home sales is down 9.8% compared to October 2023 and down 6.5% compared to November 2022. The markets with the biggest decrease in year-over-year sales percentage were Burlington, VT, at -19.1%, Portland, OR, at -17.1%, and Seattle at -15.9%. The markets with the biggest increase in year-over-year sales percentage were Manchester, NH, at +9.2%, Omaha, NE, at +6.5%, and Orlando, FL, at +4.9%.
Median Sales Price
In November 2023, the median of all 52 metro area sales prices was $405,000, down 1.2% compared to October 2023 and up 3.3% from November 2022. The markets with the biggest year-over-year decrease in median sales price were San Antonio, TX, at -5.7%, Coeur d’Alene, ID, at -3.7%, and New Orleans at -3.6%. The markets with the biggest year-over-year increase in median sales price were Trenton, NJ, at +15.5%, Des Moines, IA, at +15.1%, and San Diego at +12.7%.
Close-to-List Price Ratio
In November 2023, the average close-to-list price ratio of all 52 metro areas in the report was 99%, flat compared to October 2023, and up from 98% in November 2022. The close-to-list price ratio is calculated by the average value of the sales price divided by the list price for each transaction. When the number is above 100%, the home closed for more than the list price. If it’s less than 100%, the home sold for less than the list price. The metro areas with the lowest close-to-list price ratio had a three-way tie between Bozeman, MT, Coeur d’Alene, ID, and Miami at 95%. The metro areas with the highest close-to-list price ratios were Hartford, CT, at 103%, followed by a tie between San Francisco and Trenton, NJ, at 102%.
Days on Market
The average days on market for homes sold in November 2023 were 40, up four days compared to the average in October 2023 and up one day compared to November 2022. The metro areas with the lowest days on market were Baltimore at 13, Washington, DC, at 15, followed by a tie between Philadelphia and Trenton, NJ, at 16. The highest days on market averages were in Fayetteville, AR, at 86, Coeur d’Alene, ID, at 80, and Bozeman, MT, at 71. Days on market is the number of days between when a home is first listed in an MLS and a sales contract is signed.
Months’ Supply of Inventory
The number of homes for sale in November 2023 was down 1.6% from October 2023 and down 2.6% from November 2022. Based on the rate of home sales in November 2023, the month’s supply of inventory was 2.6, up compared to 2.3 in October 2023 and 2.5 in November 2022. In November 2023, the markets with the lowest months’ supply of inventory were Trenton, NJ, at 0.8 and Hartford, CT, at 1.0, followed by a tie between Manchester, NH, and Seattle at 1.1. The markets with the highest months’ supply of inventory were San Antonio at 5.3, followed by a tie between Bozeman, MT, and Miami at 4.8.
To read the full report, including more data, charts, and methodology, click here.
Are you looking for the best game apps to win money? Yes, you can actually play games to win real money on your phone and make extra money. There are lots of apps for both iPhones and Androids that let you do this. If you already spend a lot of time playing games on your…
Are you looking for the best game apps to win money?
Yes, you can actually play games to win real money on your phone and make extra money.
There are lots of apps for both iPhones and Androids that let you do this. If you already spend a lot of time playing games on your phone, then you might as well get paid for it, right?
In this article, I’m going to talk about some really good game apps that let you win actual money prizes. These games include ones like those you might find in a casino as well as easier puzzle games and even arcade style games. So, there’s something for everyone. When you play and collect points or coins, you can get your winnings through easy ways like PayPal and Apple Pay.
Key Takeaways
Playing game apps can be fun and you can even win real money.
The best game apps that pay real money include KashKick, Swagbucks, and InboxDollars.
Popular payout methods include PayPal, Apple Pay, and gift cards.
Game apps pay real money rewards because they make their money from ads and in-app purchases. They give you a portion of their earnings to encourage you to continue playing their games.
Do any game apps actually pay real money?
Yes, some game apps do pay real money or in gift cards. They most likely will never be a main source of income or a full-time job, though – simply just a way to make some extra money.
Why do game apps pay you real money?
Game apps that give out real money usually make money through ads, things you buy in the app, and paid gaming competitions/tournaments. They share a little of what they earn with you to get you to keep playing their games.
Sometimes, game apps have partnered with different game developers and companies so that people will try new games and earn rewards for them. Since the game app is being paid and they want more people to play the game, they then will share some of their earnings with you to get you to keep playing the games in their app.
It’s a win-win! You get to enjoy yourself and make some extra money, and businesses get to showcase their ads and games to a wider audience.
Recommended reading: 30 Best Money Making Apps
Best Game Apps To Win Real Money
Here’s a quick list of the top game apps that pay real cash:
KashKick
Swagbucks
InboxDollars
Below, I dive further into the best game apps to win real money.
1. KashKick
I think the best game app to win real money is KashKick.
KashKick allows you to earn $100 or more by playing popular mobile games like Yahtzee and Monopoly GO. You can also make money by trying new products and services, watching videos, answering surveys, and reading emails.
There are many different games you can play on KashKick such as:
Coin Master
Monopoly GO
Yahtzee
Family Island
Bingo Blitz
Scrabble Go
Solitaire Smash
MGM Slots
For example, here’s how you can make money playing Monopoly Go on KashKick: “Install (make sure to accept tracking requirements on your device!) and reach Board 27 within 8 days from the install date to get $30, reach Board 42 within 12 days for $40 more and reach Board 71 within 24 days for another $50 – for a total of $120!”
Please click here to sign up for KashKick for free.
Recommended reading: KashKick Review
2. Swagbucks
Another favorite game app to win real cash is Swagbucks.
Swagbucks is a very popular rewards site where you can earn money by playing games, taking surveys, watching videos, and shopping online, and you can cash out what you earn with PayPal cash or gift cards.
Swagbucks is a company that I started using years ago, and it has helped me easily earn some extra cash on the side, all from home or while traveling. I have personally earned over 100 free gift cards through Swagbucks, so I know that they are a legit game app that pays you real money!
To play games on Swagbucks, you simply head to the “Play” tab when you are logged in. When I logged in, I had over 20 available games that I could get paid to play, with a total rewards value of $2,264.02 or 226,402 SB points.
Some of the games you can play on Swagbucks include:
Match Masters
Farmville
Lucky Buddies
Dragonscapes Adventure
Wizard of Oz Slots
Solitaire Smash
POP! Slots
Dice Buddies
Swagbucks Live
If you join Swagbucks through my referral link, you can receive a $10 bonus.
Recommended reading: Swagbucks Review
3. InboxDollars
InboxDollars is another good rewards site that pays you cash for taking surveys, shopping online, playing games, and reading certain emails. In fact, InboxDollars has been around since 2000, and they have paid over $80 million in cash and gift cards.
They pay via PayPal cash as well as gift cards to places such as Amazon, Apple, Target, Dunkin’ Donuts, Lowe’s, Barnes & Noble, and Gap.
To play games on InboxDollars, simply head to the tab that says “Games.”
When I log in, I have 8 games available for me to currently play, such as Mahjong Dimensions, Solitaire, Word Wipe, Monkey Bubble Shooter, Pyramid Solitaire, Candy Jam, Pet Hop, and Giant Hamster Run.
Sign up for InboxDollars here and get a free $5 bonus.
4. PrizeRebel
PrizeRebel is a popular rewards site where you can play games (as well as take surveys that pay instantly and more). You can redeem your rewards points for PayPal cash, gift cards, and even cryptocurrency.
Some of the games on PrizeRebel include Bingo Blitz, Solitaire Grand Harvest, Age of Apes, Kingdom Guard, Yahtzee, Woody Sort, Viking Rise, and more.
You can sign up for PrizeRebel here.
5. MyPoints
MyPoints is a rewards platform where you can earn money by playing games, watching videos, and participating in surveys. Your earnings can be redeemed as gift cards or PayPal cash.
To get paid to play games on MyPoints, you log in and head to the “Games” tab, and there you will see games such as Bejeweled, Bingo, Catch 21, Puzzle Match, Wheel of Fortune, and more.
Sign up for MyPoints by clicking here.
6. Blackout Bingo
Blackout Bingo is a highly-rated bingo game app that allows you to win real cash. In fact, there are nearly 90,000 reviews on the App Store alone, with an average of 4.5 out of a 5 star rating.
Over 5,000,000 people have played this bingo app where you can win rewards and cash prizes too.
You play against other players in real time and can cash out your winnings via PayPal.
7. Bingo Cash
Bingo Cash is a fun game of Bingo that you can play for free, and you can play against other people no matter where you are in the world. You get to “travel” to different places in the game and practice your Bingo skills. Plus, you can win really big prizes!
Bingo Cash is a free game that you can play on the popular gaming platform called Papaya.
It’s easy and safe to get your prize money through PayPal. You can choose from lots of cool prizes like Airpods Pro, iPads, and coffee makers!
Note: If you live in AZ, AR, CT, DE, LA, MT, SC, SD, or TN, you can’t join prize tournaments. But don’t worry, you can still play for fun with the game app’s virtual currency.
8. Solitaire Cube
If you like to play solitaire, then this is the game app for you as you can get rewarded for playing just like how you normally do.
Solitaire Cube is a card game app that allows you to test your card skills and win real money. The game is available for free on iOS and Android and is perfect for solitaire fans who want to put their skills to the test.
With this game app, you play against other real players all from your phone. Your rewards can be cashed out for PayPal cash or Apple Pay.
9. Mistplay
Mistplay is one of the most popular game apps to win money, with over 400,000 reviews and an average rating of over 4.1 stars out of 5. There have been over 10,000,000 downloads of this app too!
Mistplay is an app where you can earn money by playing and testing new games on your smartphone. It’s a great option if you enjoy discovering new games and want to make some extra cash.
Mistplay has given away $60,000,000 in rewards for playing games since the site was created too.
You can redeem your points for PayPal cash or gift cards to Visa, Amazon, and more.
Note: This app is currently only available for Android phones on Google Play.
10. Fanduel Fantasy Sports
If you like football, soccer, hockey, baseball, basketball, golf, and other sports, then this is the app for you.
Fanduel Fantasy Sports is a sports betting site where you create your fantasy sports lineup and compete with other players for cash prizes.
With this app, you have a chance to win real money. You simply create your fantasy team, keep an eye on your scores, and compete every day for prizes in lots of different fantasy contests.
Note: Fanduel Fantasy Sports is only open to U.S. residents and users must be 18 or older (19 or older in AL, 21 or older in AZ, IA, LA, MA). Users physically located in DE, ID, HI, MT, NV, and WA are not eligible to participate in paid contests.
11. Cash’em All
If you’re a casual gamer and want to play games in your spare time for a chance to win real cash, give Cash’em All a try.
This app doesn’t bother you with in-app purchases or ad walls. Instead, you earn points, or “coins” as the app calls them, for each second you play their games.
There are many different games that you can play on Cash’em All, such as Candy Crush, Match Masters, Bingo Blitz, Coin Master, and more.
You earn points which then can be exchanged into PayPal cash or gift cards to places such as Netflix, Amazon, and more.
Note: This app is currently only available for Android phones on Google Play.
12. 21 Blitz
21 Blitz is a blackjack and solitaire hybrid card game where you can win real money, and it’s a fun choice for people who like card games. Also, it’s great for practicing blackjack, exercising your brain, or simply having fun.
You can play against real people for free. When you feel ready, you can switch to cash games and have a chance to win real money.
This game is a part of the Skillz platform, which is a popular game app platform where people can win real money through their collection of different games that they have (they have some of the best games to win real money).
13. Pool Payday
Pool Payday is the top pool game app where you can play 1-on-1 pool games and win real cash prizes.
This is a free game app where you can win real money taking pool shots and winning points.
The app is available on iOS devices through the App Store, and you can withdraw your winnings via PayPal cash or Apple Pay.
Note: You can join cash tournaments in most places around the world. However, if you live in AZ, AR, CT, DE, IL, IN, LA, ME, MT, SC, SD, or TN, cash tournaments are not available. But, you can still play for free if you live in these states.
14. Bubble Cash
If you like bubble shooter games, then this is the best bubble shooter game app.
Bubble Cash lets you play against other players in real-time bubble shooter games, with the chance to win cash prizes. Bubble Cash is a bubble shooter game where the more bubbles you pop, the higher your chances of winning.
I know people who spend hours playing these types of games, so this can be a fun way to get rewarded to play a favorite game.
Here’s how to play:
Match three bubbles of the same color to pop and clear the board.
Tap the screen to aim the laser, then lift your finger to shoot the ball.
You can download the app on iOS and Android devices.
15. Solitaire Cash
Solitaire Cash is a card game app where you can play solitaire games for real money.
Once you download the game for free, you can play regular or cash tournaments and have a chance to win real money.
You’ll play against players of similar skill levels, and everyone gets the same deck. So, the game is fair and based on your skills.
The app is available on iOS and Android devices.
16. Rewarded Play
Rewarded Play is an app that pays you for playing games on your phone. If you want to play a variety of games, then this is the app for you.
You can play games such as Scrabble, Yahtzee, Bingo Blitz, Wheel of Fortune, and more.
The way the app works is that they introduce you to new games. Then, the more time you spend playing their games, the more points you can earn. Your points can be redeemed for gift cards to places such as Amazon, Walmart, Target, Nordstrom, and more.
17. Dominoes Gold
Dominoes Gold is one of the best dominoes game apps where you can put your domino skills to the test and win cash prizes.
You play by challenging your opponent in the same games against the computer and see who can win with more points.
The app is available for iOS devices, and you can cash out your winnings via PayPal.
18. AppStation
AppStation is an app that pays you for playing new games on your phone. You can earn coins by trying different games and then redeem them for PayPal cash or gift cards. Games include Fishdom and Match Royal.
Note: Only available for Android users.
19. Jackpocket
Jackpocket is an app that lets you play lottery games and potentially win real cash prizes. You can buy lottery tickets through the app and even be notified if you win. This can be an easy way to play your local lottery games right from your phone.
You can have Powerball, Mega Millions, Cash4Life, and other lottery tickets from NY, NJ, and NH sent directly to your phone.
Just pick your game and numbers (or use Quick Pick), and the app will safely get your ticket from a licensed lottery seller.
If you win less than $600, the money goes directly to your Jackpocket account. For big wins, they make sure to safely deliver you your ticket so that you can redeem your winnings yourself.
20. Cookie Cash
Cookie Cash is a Match 3 puzzle skill game from Papaya Gaming that is for the iPad and iPhone.
With Cookie Cash, you can play as much as you want for free. Then, once you’re ready, you can compete against other players for prizes and real money, such as PayPal cash and Apple Pay.
Note: Cash tournaments are not available in the states of AZ, IA, LA, and SC.
21. Money Well
Money Well has many arcade-style games that you can play to win real money, and this is a very popular game app with over 10,000,000 downloads and an average rating of 4.3 stars out of 5 stars (with over 528,000 reviews!).
You can simply play the games, collect coins, and cash out your earnings for PayPal cash and gift cards to places such as Grubhub and Apple.
22. Bingo Clash
Bingo Clash is a bingo game app from AviaGames with high ratings, and they give real money payouts through PayPal, Apple Pay, Visa, Mastercard, American Express, and Venmo. You can play this game for free and enjoy the competitive nature of real-time bingo.
You’ll play against real players who have similar skills and compete in classic, fun, and fair cash games based on your skills. You can also take part in tournaments with different match styles, and the higher you place, the bigger your prize.
Note: Cash games are not available in the following states of AZ, AR, CT, DE, LA, MT, SC, SD, TN, and VT. But, if you live in one of these states you can still play the game for free.
23. Spades Blitz
Spades Blitz is a card game app where you can win cash earnings by playing and mastering the popular card game of spades.
With Spades Blitz, you compete against real people from around the world in tournaments, where you pay an entry fee to take part.
You can get paid via PayPal cash or check.
Note: The app is available on the App Store and the Galaxy Store. Currently, Spades Blitz is only available for iPhones and Samsung devices.
More Ways To Get Paid To Play Games
There are more ways to get paid to play, other than the game apps listed above. If you like to play games and want to make money, some other ideas to look into include:
Become a Twitch streamer
Twitch is a site where you can make money playing video games, talking, and more.
If you like playing video games, live streaming yourself playing can be a way to make money doing what you love. As you gain followers and subscribers on Twitch, you can earn income through ads shown on your stream, donations from viewers, and monthly subscription fees.
Most Twitch streamers don’t earn a full-time income, but there are some who make well over $100,000 annually. In fact, a few even bring in millions of dollars each year.
To see success on Twitch, I recommend finding ways to keep your audience interested, playing the games that you actually enjoy, and sticking to a regular streaming schedule (because your followers will want to see you consistently!).
You can learn more at How Much Do Twitch Streamers Make?
Play in game tournaments
Playing in gaming tournaments can be a way to make money if you’re really good at a certain game.
Many popular competitive games like Fortnite, League of Legends, and Call of Duty host large-scale tournaments with large prize money.
You’ll need to practice a lot, though, as there are many good players in all games – and you want to be the best in order to actually make some money.
Start a gaming blog
If you love games, then you may be interested in starting a gaming blog.
Starting a gaming blog gives you a platform to share what you know about games, your thoughts on games, and your experiences with other gamers. You can make money from your blog through ways such as affiliate marketing, sponsored content, display ads, or even by selling merchandise.
You can learn more about how to start a blog here.
Become a game creator
If you love gaming and have an interest in design or programming, think about making your own games. Independent game creators can build games for different platforms like PCs, consoles, or even phones.
While a college degree isn’t always required, it can be very helpful. You may want to get a degree in fields like game design, computer science, or graphic design, and also look for courses specific to game design.
First, try finding internships, co-op programs, or beginner-level jobs at companies that make video games. This will give you important experience in the field and let you learn from people who have been doing this for a while.
Sell game merchandise
If there’s a popular game out there, then you may be able to sell merchandise to earn some extra cash.
Some examples of merchandise include T-shirts, posters, or accessories based on popular games.
Of course, you will want to make sure that you can legally do this, as you don’t want to get in trouble for pretending to be a certain game app or anything like that.
My Tips For Playing Game Apps That Pay Real Money
Below are my tips for getting paid to play game apps from your phone.
Be smart about how much time you are spending.
When playing game apps, it can be really, really easy to let time get away from you and play too much (especially if you are a winner!). After all, you are probably having fun and it’s something that you can easily do from your phone.
But, you don’t want to forget about everything else in your life.
You don’t want your game app playing to turn into an obsession (such as with arcade games or trivia games) or into a gambling addiction (as many of the above are similar to casino games).
So, I recommend being careful with any games that require you to pay money (such as to join tournaments) and know your limit. You may want to set a timer for playing and a budget.
You may have to pay taxes.
If you’re winning money from these game apps, then you will need to pay taxes. This means that you will want to save money from any of your winnings for taxes so that you are not surprised at the end of the year with a huge tax bill.
Read real reviews and experience with game apps that pay money.
When you’re trying out different game apps where you win real money, it’s important to read real reviews and experiences. This helps you make a smart choice as reading honest thoughts from other players can give you a clear picture of the app’s pros and cons, how they pay out, how easy they are to play, and if people actually enjoy them.
Some things in game app reviews to look out for include:
If the customer service support is helpful (do they actually answer emails if you have an issue?)
If payments are actually being made and if they are on time (if many people are leaving reviews saying that they are not getting their payments, then you may want to do more research before you start playing games on that specific app)
If the game is fun (of course, this is just an opinion and everyone is different, though)
Keep in mind, while winning real money in gaming apps can be exciting, it’s important to remember that it’s not a full-time job with a full-time income. Always focus on having fun first.
Frequently Asked Questions About Playing Game Apps To Win Money
Below are answers to common questions about playing game apps to win real money.
Which games are best for earning real money? What are some popular real cash games?
There are many game apps that can help you earn real money and some of the top game apps are KashKick, Bingo Cash, Blackout Bingo, Solitaire Cash, and Mistplay. You may want to test a few and see which one is a game that you actually like.
How can I find legit cash games?
To find real cash games that you can trust, you should look for ones that are popular and have good reviews by looking at the Apple Store or Google Play Store to read user ratings and reviews. This can give you a good sense of the game’s legitimacy and whether or not they actually pay out the rewards you earn.
Do any game apps offer instant payouts?
Even if some game apps claim to have instant payouts, the actual time it takes can still vary. Usually, it might range from a few minutes to a couple of days for your rewards to show up in your account.
Are there money-making game apps for iPhones?
Yes, there are several money-making game apps available for iPhone users. Some of the popular ones include Solitaire Cube, 21 Blitz, and Blackout Bingo.
Can I earn money directly to my bank account with game apps?
Certain game apps let you transfer your earnings directly to your bank through direct deposits, while others pay through PayPal, Apple Pay, Amazon gift cards, or other cash rewards.
Game Apps To Win Money – Summary
I hope you enjoyed this article on how to play game apps to win money. As you can see, you have many options!
To sum it up, there are game apps that give real money rewards, and they can be a fun way to spend your time. But remember, they shouldn’t be your main source of income. Think of them as a fun way to make a bit of extra money.
Do you play any game apps to win money? Which one is your favorite?
By the end of 2022, 27 million Americans had an outstanding personal loan balance with the average amount owed being $11,116. The interest rates of these loans are also the highest they’ve been since 2011 at 11.23 percent.
Sources: TransUnion and the St. Louis Federal Reserve
As of the second quarter in 2022, Americans owed over $192 billion in personal loans, according to TransUnion®. This was a 31% increase from 2021 and is thought to be due to the financial hardships Americans experienced during the COVID pandemic that overwhelmed the nation in 2020.
If you’re one of the many Americans who took out a personal loan in early 2022, the good news is that interest rates were very low, according to the St. Louis Federal Reserve. Since then, rates have reached new highs, so many Americans are struggling to pay back these loans.
Understanding the current trends in personal loans can help you see where you stand financially. We’ve gathered 10 personal loan statistics that include the most common reasons people take out personal loans, delinquency rates and which states have the highest personal loan debt to help you make better financial decisions if you’re accumulating too much debt.
In This Piece
Must-know Personal Loan Statistic Findings
Millions of Americans are taking out personal loans, and the following are some of the most interesting facts on the topic.
Get matched with a personal
loan that’s right for you today.
Learn
more
27 million Americans have personal loan debt (TransUnion)
At the end of 2022, the average new loan amount was $8,018 (TransUnion)
The average amount owed in personal loan debt was $11,116 at the end of 2022 (TransUnion)
In November of 2022, personal loan interest rates were the highest they’ve been since May of 2011 (St. Louis Federal Reserve Bank)
New Jersey has the highest average new personal loan account balance at $13,494 (TransUnion)
Average Personal Loan Debt in America
According to TransUnion, Americans owed roughly $9,896 on average as of the first quarter in 2022, the highest it’s been in recent years. Americans took out loans at an average of $6,656 per loan, which was over $1,000 more than in the previous quarter of 2022.
The amount owed per borrower dropped significantly between Q2 and Q3 in 2022, but by the end of the fourth quarter, the average amount owed increased by over 100 percent with the new loan amount dropping to $8,018.
The increase in personal loan debt may have been due to the inflation the country experienced in 2022. TransUnion also reports that there were more loans approved to “super prime borrowers,” or those with credit scores over 720, stating, “On a percentage basis, personal loan originations for subprime and near-prime borrowers increased in the single digits [year over year] whereas super prime borrowers experienced a 33% rise in the third quarter.”
How Many Americans Have Personal Loans?
The amount of Americans taking out personal loans increased 12 percent from 23.9 million in the first quarter of 2022 to 27 million by the fourth quarter.
Prior to the beginning of the COVID-19 pandemic, the total amount of personal loan borrowers was 23.3 million at the end of 2019 and dropped to 21.2 million by the end of 2020. The number of borrowers then grew back to 22.8 million in the following fourth quarter of 2021 and continued to grow as the pandemic regressed.
Quarter
Q4 2022 Average new account balance
Q4 2019
23.3 million
Q4 2020
21.2 million
Q4 2021
22.8 million
Q4 2022
27 million
The Most Common Reasons to Take Out a Personal Loan
LendingTree conducted a survey of their users in 2022 and found that the most common reason consumers took out personal loans was to pay down other debts. Over 58 percent of borrowers used these loans to pay down debt, and the other main reasons included credit card refinancing, home improvements and other major purchases.
Rank
Reason
Percentage of respondents
1
Debt consolidation
41%
2
Other
17.3%
3
Credit card refinance
17.3%
4
Home improvements
6.2%
5
Major purchase
4.1%
6
Medical expenses
3.0%
7
Moving/relocation
2.9%
8
Everyday bills
2.9%
9
Car financing
1.7%
10
Car repair
1.1%
11
Business
0.9%
12
Vacation
0.5%
13
Homebuying
0.4%
14
Wedding expenses
0.4%
Average Personal Loan Interest Rates
During the second quarter of 2022, the Federal Reserve Bank of St. Louis reported that interest rates reached an all-time low of 8.73 percent. By the end of the year, these rates were the highest they’ve been since 2011 at over 11.2 percent.
Personal Loan Debt Compared to Other Debts
Based on TransUnion data, personal loans account for less than four percent of the total number of accounts when compared to other types of loans, such as credit cards, home and auto loans.
Account type
Number of accounts
Percentage of accounts
Credit card
518.4 million
76.3%
Auto loan
81.2 million
11.9%
Mortgage loan
52.6 million
7.83%
Personal loan
27 million
3.97%
It’s also important to note that not all credit card accounts carry a balance.
Personal Loan Delinquency Rates
Delinquent accounts are accounts 60 days or more past due and can hurt your credit score. The Q4 TransUnion report shows that the delinquency rate dropped year over year between 2019 and 2020, but was up 53 percent as of 2022, with an overall delinquency rate of 4.14 percent.
Quarter
Delinquency rate
Q4 2019
3.48%
Q4 2020
2.7%
Q4 2021
3%
Q4 2022
4.14%
TransUnion’s 2022 Credit Snapshot shows that in the last month of the report, those with the lowest credit scores have the highest delinquency rate of 23.9 percent, while super prime borrowers are only at 12 percent.
Credit score range
Percentage of delinquent borrowers
Subprime (300 to 600)
23.9%
Near prime (601 to 660)
23.7%
Prime (661 to 720)
23.3%
Prime plus (721 to 780)
17%
Super prime (781 to 850)
12%
Personal Loan Statistics by State
TransUnion’s 2022 Credit Snapshot reports that New Jersey has the highest average new account balance at over $13,000, and Oklahoma has the lowest at $3,170. Although Oklahoma has the lowest new account balance, they have the highest delinquency rate at 7.73 percent.
State
Q4 2022 Average new account balance
Q4 2022 Delinquency rate
AK
$10,296
2.9%
AL
$4,362
6.59%
AR
$7,089
5.18%
AZ
$9,343
3.78%
CA
$10,454
3.47%
CO
$12,322
2.03%
CT
$11,712
2.57%
D.C.
$9,016
6.55%
DE
$9,146
4.04%
FL
$8,379
3.94%
GA
$8,621
5.18%
HI
$12,224
2.28%
IA
$7,443
2.94%
ID
$9,072
4.38%
IL
$9,236
3.46%
IN
$7,439
2.97%
KS
$8,349
3.05%
KY
$6,875
3.36%
LA
$6,797
5.07%
MA
$12,518
2.24%
MD
$10,956
2.77%
ME
$6,651
1.67%
MI
$7,052
3.21%
MN
$10,692
3.73%
MO
$6,522
6.69%
MS
$5,179
4.96%
MT
$9,326
2.53%
NC
$10,035
3.03%
ND
$8,051
1.89%
NE
$7,755
3.65%
NH
$11,719
2.31%
NJ
$13,494
3.49%
NM
$5,418
6.31%
NV
$8,839
3.74%
NY
$11,843
2.77%
OH
$7,595
3.75%
OK
$3,170
7.73%
OR
$10,523
2.93%
PA
$10,418
3.06%
RI
$8,744
2.14%
SC
$5,924
4.89%
SD
$9,945
2.06%
TN
$5,355
5.38%
TX
$4,952
6.33%
UT
$7,966
4.23%
VA
$9,875
3.37%
VT
$6,180
0.82%
WA
$9,570
2.94%
WI
$6,489
3.95%
WV
$10,864
1.96%
WY
$7,698
2.66%
Personal Loan Statistics by Type of Lender
More and more Americans are turning to financial technology companies, also known as FinTech, for their personal loans. These are online banking services that are done via a company’s website or mobile app, and 32.9 percent of all personal loans are done through these types of companies.
Lender type
Distribution of total balances
FinTech
32.9%
Banks
20.5%
Credit unions
19.7%
Other finance companies
26.9%
Can Personal Loan Debt Affect Your Credit Score?
If you’re one of the 27 million Americans with a personal loan, you don’t have to let your debt harm your credit score. As you’ve learned from these personal loan statistics, many Americans have turned to personal loans to pay off other debts, but many people are delinquent with their payments, which can hurt their scores.
Credit.com provides a variety of credit tools and tips to help you work to repair and improve your credit. You can learn more about our services, like ExtraCredit, or click here to get your free credit report card.
In the United States, it’s illegal to drive a car without car insurance. Depending on the state you’re driving in, the consequences of doing so can range from a fine to a misdemeanor on your record. So, if you’re planning on hitting the road anytime soon, be sure to purchase car insurance to avoid penalties.
In this article, we’ve researched the average cost of car insurance by state to give you a better idea of how much to budget.
Key findings:
According to AAA, the national average cost of car insurance for a full-coverage policy was $1,588 in 2022.
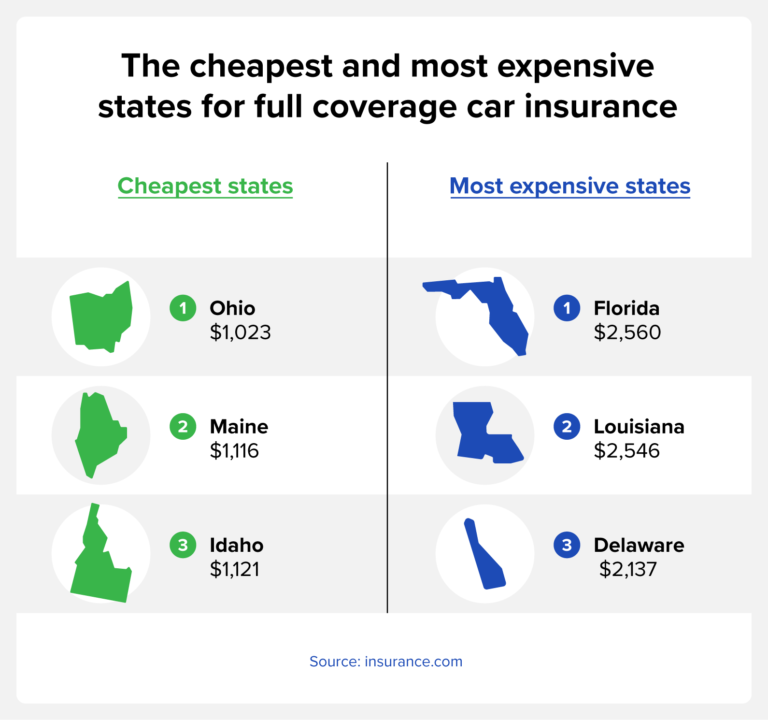
On average, the cheapest states for full coverage car insurance are Ohio, Maine and Idaho, while the most expensive states are Florida, Louisiana and Michigan.
USAA, Geico and State Farm offer the cheapest minimum coverage plans, while USAA, Geico and Nationwide offer the cheapest full-coverage insurance.
The average cost of car insurance tends to decrease with age, but starts to rise again around age 70.
Individuals with high credit scores pay lower car insurance premiums on average compared to those with poor credit.
How much is car insurance?
According to AAA, the national average cost of car insurance for a full-coverage policy was $1,588 in 2022. This figure is based on an under 65 years old driver who lives in the city or suburbs, has over six years of driving experience, and has not been involved in any accidents.
Average cost of car insurance by state
When calculating the cost of car insurance, the state you live in plays a role in how much you can expect to pay. This is because factors like population density, climate, road conditions and crime rate in your area can play a part in the likelihood that you’ll file a claim.
According to insurance.com, the cheapest states for car insurance if you’re looking for minimum coverage are Iowa, South Dakota and Wyoming costing an average of $263, $267, and $293, respectively. Meanwhile, the cheapest states for full coverage auto insurance are Ohio ($1,023), Maine ($1,116), and Idaho ($1,121).
The most expensive states for car insurance in terms of minimum coverage are New Jersey, Florida, and New York where drivers pay an average of $989, $908 and $875, respectively. For full coverage insurance, drivers in Florida ($2,560), Louisiana ($2,546), and Delaware ($2,137) pay the most in the country on average.
State
Minimum coverage
Full coverage
AK
$336
$1,359
AL
$420
$1,542
AR
$422
$1,597
AZ
$494
$1,617
CA
$582
$2,115
CO
$467
$1,940
CT
$773
$1,750
DE
$821
$2,137
FL
$908
$2,560
GA
$567
$1,647
HI
$389
$1,306
IA
$263
$1,321
ID
$326
$1,121
IL
$484
$1,578
IN
$384
$1,256
KS
$389
$1,594
KY
$717
$2,105
LA
$726
$2,546
MA
$523
$1,538
MD
$607
$1,640
ME
$330
$1,116
MI
$711
$2,133
MN
$479
$1,493
MO
$525
$2,104
MS
$434
$1,606
MT
$389
$1,692
NC
$396
$1,368
ND
$340
$1,419
NE
$350
$2,018
NH
$411
$1,307
NJ
$989
$1,901
NM
$376
$1,505
NV
$683
$2,023
NY
$875
$2,020
OH
$308
$1,023
OK
$352
$1,797
OR
$551
$1,244
PA
$398
$1,445
RI
$648
$1,845
SC
$628
$1,894
SD
$267
$1,581
TN
$368
$1,373
TX
$520
$1,875
UT
$526
$1,469
VA
$469
$1,321
VT
$306
$1,158
WA
$505
$1,371
WI
$375
$1,499
WV
$474
$1,610
WY
$293
$1,736
Average cost of insurance by company
Another factor that’s going to influence how much you can expect to pay for car insurance is the specific company you purchase your plan through.
According to U.S. News & World Report, USAA, Geico and State Farm offer the cheapest minimum coverage plans, while USAA, Geico, and Nationwide offer the least-expensive full-coverage insurance.
Farmers, Progressive, and Nationwide offer the most expensive minimum coverage rates while Allstate, Farmers, and Progressive offer the most expensive full coverage plans.
Insurance company
Minimum coverage
Full coverage
Allstate
$1,961
$2,138
American Family
$1,327
$1,388
Farmers
$1,782
$2,059
Geico
$1,064
$1,238
Nationwide
$1,347
$1,338
Progressive
$1,440
$1,650
State Farm
$1,191
$1,348
Travelers
$1,290
$1,448
USAA
$948
$1,056
Average cost of insurance by age
According to CarInsurance.com, the cost of both minimum and full coverage car insurance tends to decrease with age, as seen in the chart below. However, there is an uptick around age 70 where rates start to go back up.
Age
Minimum coverage
Full coverage
20
$1,109
$3,532
30
$539
$1,785
40
$520
$1,682
50
$496
$1,581
60
$482
$1,511
70
$554
$1,661
Average cost of insurance for young drivers
Young drivers are the most expensive age group to insure. Although there are a few exceptions, insurance rates decrease with age among young drivers.
Age
Minimum coverage
Full coverage
16
$2,402
$7,203
17
$1,971
$5,924
18
$1,706
$5,242
19
$1,234
$3,874
20
$1,109
$3,532
21
$884
$2,864
22
$794
$2,593
23
$736
$2,415
24
$690
$2,267
Average cost of insurance by credit score
According to the Insurance Information Institute, your credit score is a good indicator of how many insurance claims you’ll file. As a result, insurance companies use credit scores to determine risk, and those with a good credit score pay cheaper premiums. The Zebra found that individuals with poor credit pay approximately 114% more than those with great credit.
Credit score
Average annual rate
Very poor (300-579)
$2,887
Average (580-669)
$2,296
Good (670-739)
$1,912
Excellent (740-799)
$1,606
Exceptional (800-850)
$1,350
What factors affect your car insurance rate?
As you can see from the above charts, the cost of car insurance varies by the following factors:
Age: Typically, young drivers under the age of 25 and senior drivers over the age of 65 are charged more for car insurance.
State of residence: Since the minimum coverage required varies by state, your location is one of the factors that will influence the price.
ZIP code: In addition to your state of residence, your ZIP code will also play a role in the cost of insurance since your vehicle is more likely to be damaged in certain areas, such as ZIP codes with high crime rates. Typically, the cost of car insurance will be greater in cities than in rural areas.
Marital status: Statistically, married drivers are less risky than single drivers resulting in a lower insurance cost.
Gender: Based on risk, male teenage drivers tend to have the highest cost of car insurance of any demographic.
Credit history: Those with a low credit score tend to pay higher premiums than individuals with good credit.
Driving record: Since car insurance premiums are based on risk, individuals with a good driving record can expect to pay lower premiums, while those with a poor driving record may experience increased rates.
Car make and model: You may pay less if you drive a vehicle that insurance companies deem safe. On the other hand, you’re likely to pay more if you drive a small sports car since they pose a higher risk.
Mileage: Higher annual mileage increases the risk you’ll get into an accident and will likely raise your premiums.
High-risk violations: Driving under the influence andat-fault accidents are examples of violations that may result in you being considered a high-risk driver.
What’s the difference between full and minimum coverage?
Minimum coverage car insurance — liability coverage — is required in most states and is used if you’re at fault in an accident. This coverage will pay for damages and injuries of the other party when you’re responsible for the incident.
On the other hand, full coverage insurance, or collision coverage, includes liability coverage plus damage caused to your own vehicle. Keep in mind that lenders often require you to obtain full coverage insurance before you get an auto loan.
FAQ
Below, we’ve answered some common questions regarding the cost of auto insurance.
Can my driving record affect my car insurance rate?
Your driving record is one of the factors that affects your car insurance rate. As a result, those with traffic violations or accidents on their record can expect to pay higher premiums.
Does your car insurance cost go down after you pay off your car?
Your care insurance cost doesn’t typically go down after your pay off your car. However, you do have the option to decrease the amount of coverage on your vehicle once it’s paid off.
Which car insurance company is the cheapest?
As mentioned above, insurance companies that offer the cheapest plans include Geico, Auto-Owners, USAA and Erie.
Does car insurance decrease annually?
For young drivers in particular, car insurance rates decrease each year you renew your policy without filing a claim. You can expect to see the biggest drop in price at age 25.
The average cost of car insurance varies by factors including state, age, insurance company and credit score. Some factors, such as your age, are beyond your control, but other factors, such as your credit score, can be improved.
Check your credit score for free today to see if it’s a reason your car insurance is high.
Maple syrup and the Green Mountains, picturesque countryside and quaint villages, New England charm and outdoor recreation during the snowy winters, there is a long list of things to love about Vermont. The state’s sense of community, natural beauty, and local charm might just convince you to buy or rent a home in Vermont.
So if you’re considering living somewhere in Vermont then chances are you also have a budget you’re hoping to stay under in your home or apartment search. When it comes to buying a home in Vermont the median home sale price is $390,700.
If that price is out of your budget, don’t worry, we’ve got options to help you find a home. Redfin has collected 3 of the most affordable places to live in Vermont. And the best part is that they all have a median home sale price under the state’s average. From Bennington to Rutland, let’s jump in and see what cities are on the list.
#1: Bennington
Median home price: $141,500 Average sale price per square foot: $125 Median household income: $46,460 Nearest major metro: Albany, NY (40 miles) Bennington, VT homes for sale Bennington, VT apartments for rent
With a median home sale price of $141,500, Bennington lands the number one spot on our list as the most affordable place to live in Vermont. About 15,300 people live in this city and is roughly 40 miles from the nearest metropolitan city, Albany, NY. If you’re considering moving to this area make sure to stop by the Bennington Battle Monument where you can see Vermont, New York, and Massachusetts from the observation deck, hike White Rocks, or explore the charming downtown area.
#2: Brattleboro
Median home price: $196,500 Average sale price per square foot: $162 Median household income: $36,090 Nearest major metro: Springfield, MA (30 miles) Brattleboro, VT homes for sale Brattleboro, VT apartments for rent
Taking second place on our list of affordable cities to live in Vermont is Brattleboro. When living in this city of 12,200 people, you can check out landmarks like the Retreat Tower and the Creamery Covered Bridge. Make sure to hike the Retreat Tower Trail, and stroll through downtown where you’ll find charming restaurants, museums, and views of the Connecticut River.
#3: Rutland
Median home price: $251,500 Average sale price per square foot: $178 Median household income: $48,182 Nearest major metro: Albany, NY (70 miles) Rutland, VT homes for sale Rutland, VT apartments for rent
Our final city goes to Rutland where about 15,800 residents currently live. The median home sale price is $251,500 which is about $140K less than the median home sale price in Vermont. If you find yourself moving to the third most affordable place, make sure to hike, mountain bike, and explore the expansive Pine Hill Park, explore the nearby Aitken State Forest, and check out the local restaurants downtown.
Methodology: All cities must have over 10,000 residents per the US Census and have a median home sale price under the average median home sale price in Vermont. Median home sale price and median sale price per square foot from the Redfin Data Center during August 2023. Average rental data from Rent.com August 2023. Population and median household income data sourced from the United States Census Bureau.