Uncommon Knowledge
Newsweek is committed to challenging conventional wisdom and finding connections in the search for common ground.
Mortgage rates ticked up last week after weeks of declines while applications for home loans dropped in a sign that the housing market continues to struggle despite some recent signs of optimism.
The 30-year fixed rate inched closer to 7 percent for the week ending December 29, according to the Mortgage Bankers Association (MBA). Meanwhile, mortgage applications tumbled by more than 9 percent from two weeks earlier, lenders said.
“Markets continued to digest the impact of slowing inflation and potential rate cuts from the Federal Reserve, helping mortgage rates to stay at levels close to the lowest since mid-2023,” Joel Kan, MBA’s deputy chief economist, said in a statement shared with Newsweek on Wednesday.
The 30-year fixed mortgage ended 2023 at 6.76 percent, more than a percentage point lower than the peak of nearly 8 percent in October, he said.
“The recent decline in rates has given the housing market some cause for optimism going into 2024, but purchase applications have not yet picked up in response, with the overall level of purchase activity 12 percent lower than a year ago,” Kan said.
Economists say that activity in the housing market will ramp up if prices decline, which at the moment are elevated partly due to low supply. The existing homes market is still in the doldrums as sellers are reluctant to give up their low rates for new home loans that could cost them close to 7 percent in interest.
“The housing market has been hampered by a limited supply of homes for sale, but the recent strength in new residential construction will continue to help ease inventory shortages in the months in come,” Kan said.
Recent data shows that private residential construction moved up, according to the U.S. Census Bureau, to nearly $900 billion in November—a jump of more than a percent from the previous month, helped by spending on single-family home building.
“November was the first month in over a year when single-family construction spending rose compared to the year prior,” Yelena Maleyev, KPMG’s senior economist, said in a note shared with Newsweek on Tuesday. “Builders have become more positive about the single-family market as mortgage rates have come down from recent peaks and revived buyers’ interests.”
In a sign that rates may be entering some level of uncertainty, as the market looks to see how many rate cuts the Fed will institute in 2024, the average contract interest rate for 15-year fixed-rate mortgages decreased to 6.26 percent from 6.41 percent in the week ending December 29.
Fed policymakers held rates at 5.25 to 5.5 percent last month for the third time in a row and have suggested that they may cut rates to a possible 4.6 percent in 2024. It’s unclear yet when such cuts could come.
But declining mortgage rates could give a boost to the housing market, with builders feeling optimistic in the new year.
“Construction activity remains robust as strong demand for housing and infrastructure remain a tailwind for builders,” Maleyev said, noting that elevated rates could be a challenge for the sector in 2024. “Spending is expected to end the year on a high, with lower mortgage rates helping revive activity in the housing market.”
Newsweek is committed to challenging conventional wisdom and finding connections in the search for common ground.
Newsweek is committed to challenging conventional wisdom and finding connections in the search for common ground.
Source: newsweek.com
Mortgage demand fell over the holidays despite declining mortgage rates.
Mortgage applications decreased 9.4% for the week ending Dec. 29 compared to two weeks earlier, according to data from the Mortgage Bankers Association (MBA).
The 30-year fixed mortgage rate closed 2023 at 6.76%, more than one percentage point lower than its October peak of 7.9%, according to Joel Kan, MBA’s vice president and deputy chief economist.
“The recent decline in rates has given the housing market some cause for optimism going into 2024, but purchase applications have not yet picked up in response, with the overall level of purchase activity 12% lower than a year ago,” Kan said in a statement.
Purchase applications decreased by 5% week over week on an adjusted basis. Meanwhile, refinance applications remained at very low levels but were 15% higher than a year ago.
“The housing market has been hampered by a limited supply of homes for sale, but the recent strength in new residential construction will continue to help ease inventory shortages in the months to come,” Kan added.
The share of Federal Housing Administration (FHA) loan activity decreased to 14.5% from 15% the week prior. The share of Department of Veterans Affairs (VA) loan activity was 14.6%, down from 17.3% over the previous week, while the share of U.S. Department of Agriculture (USDA) loan activity increased to 0.5% compared to 0.4% the previous week.
Source: housingwire.com
Collectively, Americans carry trillions in household debt. And the biggest single element of that burden by far is mortgage debt: It comprises close to $12 trillion of the $17.29 trillion overall.
The average mortgage debt balance per household is $241,815 as of Q2 2023, a 4% increase from 2022.
The total mortgage debt balance in the U.S. is $12.14 trillion as of Q3 2023, an increase of $126 billion over the previous quarter.
The average mortgage balance exceeds $1 million in 26 U.S. cities, primarily on the East and West Coasts.
Mortgage originations collectively total $386 billion, as of Q3 2023, well below the trillion-dollar levels in 2020-21.
Total home equity line of credit debt equals $349 billion as of Q3 2023, more than a $25 billion year-over-year increase.
The average credit score for purchase mortgage holders is 733 as of November 2023.
The total debt service to income ratio (DTI) of U.S. households is projected to rise to 11.7% by 2025, up from 9.9% in 2022. The mortgage DTI alone will increase to 4.5%.
Total U.S. household debt is $17.29 trillion as of Q3 2023, an increase of $3.1 trillion since the end of 2019.
Mortgage debt is the heavyweight when it comes to household debt, dwarfing credit card balances, student loans and auto loans. After the tough blow dealt by the 2007-08 subprime mortgage crisis, the annual average mortgage debt declined sharply. However, since 2013, the pendulum began to swing back, with mortgage debt on a steady rise. Since the pandemic, increases in home prices and in interest rates kicked the climb into overdrive.
So, what does this mean for the annual average American mortgage debt in 2024? With housing inventory still tight, interest rates still elevated, and people seeking larger homes to accommodate their evolving lifestyles, mortgage balances will likely continue to grow, though perhaps at a slower pace.
Mortgages continue to be a significant portion of household debt in the United States, with a current total of $12.14 trillion owed on 84 million mortgages. This equates to an average American mortgage debt of $144,593 per person listed with a mortgage on their credit report. Despite interest rates hovering above 7 percent, mortgage demand remains strong, driven by two key factors: an increase in the number of people seeking mortgages, and larger mortgages at that.
The record-low mortgage interest rates of recent years allowed buyers to purchase higher-priced homes or refinance their existing mortgages while maintaining low monthly payments. This has led to a rise in outstanding mortgage debt, which currently accounts for 70.2 percent of consumer debt in the U.S., according to New York Federal Reserve figures.
Here’s a look at the other common types of debt among American households, based on credit reporting company Experian’s midyear consumer debt review:
Auto loans. In the year between Q2 2022 and Q2 2023, auto loan debt witnessed a 5.8 percent increase, rising from $1.42 trillion to $1.5 trillion. This rising trend in auto loan debt can be attributed to persistent inventory shortages, escalating prices for new and used vehicles, and supplementary expenses such as auto insurance.
Credit card debt. Between Q2 2022 and Q2 2023, credit card debt surged by 16.3 percent, amounting to a total of $1.02 trillion. This increase is largely attributed to factors such as inflation and increasing credit card interest APRs. In a similar vein, unsecured personal loans also saw a 21.3 percent growth spurt, moving from $156.1 billion in 2022 to $189.4 billion in 2023.
Home equity lines of credit (HELOCs). As of Q2 2023, HELOCs have seen an 8.5 percent increase compared to the same quarter in 2022, reaching a total of $322 billion. This growth can be attributed to several factors. Firstly, the ongoing rise in home prices has increased homeowners’ equity, making it easier for them to tap into their home’s value through HELOCs. Additionally, the current high interest rate environment has made borrowing against home equity more attractive than refinancing a mortgage or taking out other types of loans.
Student loan debt balances. Student loan debt has long been a significant player in U.S. household debt. However, an 8 percent decrease occurred between Q2 2022 and Q2 2023, with loan balances falling from $1.51 trillion to $1.39 trillion. Influential factors behind this decline include the moratorium on interest on student loans, borrowers making payments during the three-year payment pause that concluded this year, and loan forgiveness initiatives introduced by the Department of Education.
Americans generally begin taking on debt as young adults, taper off their pace of borrowing in middle age and work to pay off loans near or during retirement.
|
Generation |
Average mortgage debt |
|---|---|
|
Generation Z |
$229,897 |
|
Millennials |
$295,689 |
|
Generation X |
$277,153 |
|
Baby boomers |
$190,441 |
|
Silent Generation |
$141,148 |
Source: Experian
For each generation, this trend has taken place in tandem with mortgage rate fluctuations and home price appreciation, which has accelerated dramatically in recent years. In February 2012, the median existing-home price was $155,600, according to the National Association of Realtors. By the same time in 2017, the median was $228,200. As of November 2023, the median home price was $387,600.
These states had the highest average outstanding mortgage balance per borrower as of the end of 2022, according to Experian:
District of Columbia – $492,745
California – $422,909
Hawaii – $387,277
Washington – $331,658
Colorado – $319,981
In these states, borrowers are much closer to paying off their home loans:
West Virginia – $124,445
Mississippi – $139,046
Ohio – $139,618
Indiana – $141,238
Kentucky – $144,222
In comparison to other types of household debt, mortgage debt often tends to take the lion’s share — largely due to the substantial cost of real estate (a home is likely to be the single biggest asset an individual ever purchases). While mortgage debt tends to be sizable, it is spread over a lengthy period, usually over a term of 15 to 30 years. This mitigates its impact on a household’s monthly budget, especially when compared to high-interest, short-term debt like credit card balances.
That longevity works to borrowers’ advantage in another way: Lenders often view mortgage-holders favorably for their demonstrated ability to manage large, long-term financial commitments. In fact, in contrast to other obligations, a mortgage is often viewed in a positive light by creditors, because — unlike with personal loans or credit card bills — your payment acts as an investment in an appreciating asset. Each monthly installment you pay reduces the principal owed on your house, increasing your stake in the property over time. This home equity can later be leveraged for financial liquidity or for securing lower-interest loans — or just held onto, enhancing your net worth and those of your descendants.
In short, a mortgage is considered “good debt,” due to its role in building equity, growing wealth and demonstrating creditworthiness.
Source: finance.yahoo.com

Well now that the Super Bowl is over, it’s time to look forward toward spring and the rest of 2013.
The holidays have passed and now many individuals are determining what their financial goals are for the year.
Is this the year to finally sell a home, buy a home, or just continue to sit tight?
While all those questions may have different answers, depending upon your current position, it’s clear that it’s a seller’s market right now.
It’s not a traditional seller’s market, largely because most homeowners don’t have much home equity, but the current environment does favor sellers because inventory is just so tight.
There’s also voracious demand at the moment, thanks to the perception that the worst is now behind us, and that if you buy in now, you’ll get a cheap home with an even cheaper mortgage.
Unfortunately, this herd mentality often precedes a bubble, that is, an unwarranted surge in price before a sudden and dramatic correction.
So, are we in for more trouble, now that seemingly every pundit, analyst, government official, interested party, and American is in on the supposed recovery?
The few who believe we are in for another bubble basically think the Fed created artificial demand for housing by pushing mortgage rates to new record lows, via quantitative easing like QE3.
It’s hard to argue with that fact – mortgage rates did indeed fall to unprecedented levels, and with that seemed to come a newfound demand for housing.
But even though demand is up, home sales are still lower than they have been historically.
All the recent “killer numbers” are only good, or improved, relative to the preceding dismal years.
And one could argue that home prices are on the mend because they’re cheap, not because rates are low. After all, plenty of recent sales have gone to cash buyers who could care less about rates.
If you look at the historical relationship of home prices and mortgage rates, it’s not what you’d think.
There’s not much of a correlation, and higher mortgage rates could actually come with higher home prices as a result of an improving economy.
It’s not as if the moment rates rise home prices will plummet, though the current situation is a little unprecedented.
Additionally, home prices are only up from the “bottom,” and nowhere close to fully recovered, assuming they eventually match the prices seen during the previous bubble, which history tells us they will.
In other words, inventory shortages and low prices are the real driver of demand at the moment, not necessarily low rates.
The low rates are more a boon to those looking to refinance their now expensive mortgages, not reason alone to purchase a home.
Housing bears also believe unemployment will continue to hinder a real recovery, and that there just aren’t any real buyers, only speculators.
The reasoning here is that there aren’t any first-time homebuyers because the economy is in the dumps, and there aren’t any move-up buyers because existing owners don’t have equity.
I think this is a convenient way of summing things up, but doesn’t represent reality. There are plenty of individuals who “missed” the first bubble, and have been patiently waiting to get in this time around.
There are also millions of existing owners with plenty of equity that want to buy again, especially at much lower prices.
To further argue against another housing bubble, the quality of mortgages this time ‘round is night and day.
Can you really compare a 30-year fixed at 3.5% to an option arm with a 1% teaser rate, which after five years, will reset to a fully-indexed and variable rate of 6% or higher.
Or a more straightforward interest-only ARM that becomes fully amortizing (and fully indexed) after 10 years, pushing a homeowner to the brink of default?
Oh, and those types of loans were also taken out at the height of the market, making mortgage payments that much more unsustainable.
Today, borrowers are taking out mortgages they can truly afford, with more skin in the game and no surprise resets in the future. Surely that will make for a more bubble-resistant housing market going forward.
But don’t be surprised if there are some hiccups along the way, because there will always be ups and downs.
Read more: What caused the housing crisis?
Source: thetruthaboutmortgage.com
Well, 2012 is now in the rear-view mirror, and looking back, it was a good year for housing, if the numerous recent research reports are any indication.
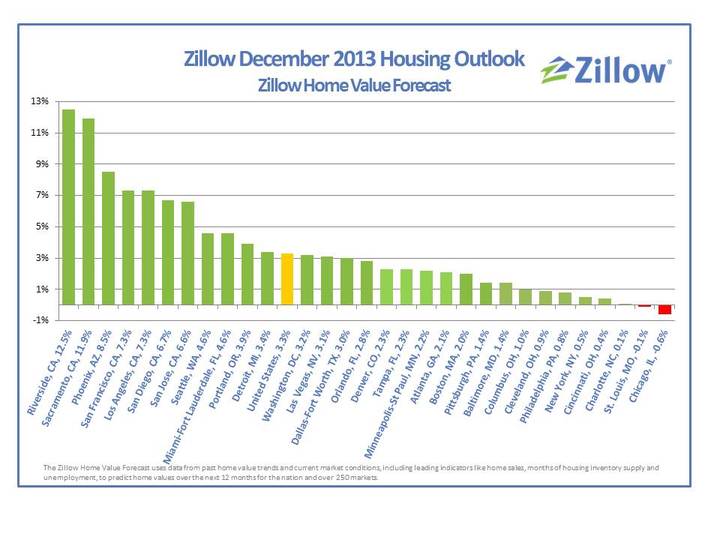
The latest shot of good news came from Zillow, which reported Monday that U.S. home prices increased 5.9% last year.
Their Home Value Index (ZHVI) increased to $157,400 in the fourth quarter, up a strong 2.5% from the third quarter.
In 2012, home values increased in all four quarters thanks to relatively low asking prices and limited inventory.
The biggest gains were seen in the hardest-hit areas, including Phoenix, AZ, where prices jumped a staggering 22.5% last year.
They’re expected to climb another 8.5% this year, though one should keep in mind that they fell 56.2% from peak to trough.
The Las Vegas and Miami metros have also been winners over the past few years, though they too experienced nasty home price drops post-crisis.
The biggest gainers for 2013 are expected to be Riverside, CA (12.5%), Sacramento, CA (11.9%), Phoenix (8.5%), San Francisco (7.3%), and Los Angeles (7.3%).
The bottom five include Chicago, where home prices are expected to drop 0.6%, and St. Louis, where prices are slated to dip by a meager 0.1%.
Home price appreciation is also projected to be quite poor in Charlotte, NC (0.1%), Cincinnati, OH (0.4%), and New York City (0.5%).
So as always, the outlook is local and regional, though home prices are still expected to rise in most areas nationwide.
Today, the National Association of Realtors also announced that existing home sales increased 9.2% last year compared to 2011.
The preliminary annual count was 4.65 million sales, up from 4.26 million a year earlier.
It was the highest annual total since 2007, and also the biggest year-over-year increase since 2004.
Meanwhile, inventory is still rock bottom. As of the end of December, total inventory fell 8.5% to 1.82 million existing homes available for sale, a 4.4-month supply at the current sales pace.
That’s down from 4.8 months in November, and represents the lowest housing supply since May 2005, which was close to the apex of the housing boom.
Unfortunately, the near-six percent appreciation rate was much higher than the “healthy” norm, representing the largest annual increase since 2006, when the market was on the cusp of going bust, per Zillow.
The company noted that the historic standard for home price gains is around three percent annually. So are we repeating history again?
Not so fast. Sure, home prices have increased quite a bit, but they’re still nowhere near where they were in 2006 – 2007.
And home price appreciation is expected to temper quite a bit this year, falling back in line with the historic average, with a 3.3% increase anticipated in 2013.
Last year, home prices probably rose a lot more than normal because of the record low mortgage rates and severe inventory shortages.
But thanks to recent home price gains, a lot more inventory has essentially been “created.”
I’m talking about the many underwater homeowners who were essentially trapped in their homes.
In the third quarter alone, roughly 100,000 homeowners gained positive equity enlightenment, meaning they can now pursue standard sales instead of selling short.
At the same time, short sales are expected to be quicker and more commonplace, so there should be plenty of housing inventory.
Yes, it means home prices won’t continue to surge, but it also means healthier growth, not just another short-term bubble.
And with today’s mortgages of much better quality than their pre-crisis brethren, it bodes very well for the future of housing.
Source: thetruthaboutmortgage.com

Hyperinflation occurs when prices for goods and services rise uncontrollably. It is an economic condition that fuels nightmares for consumers and for economists alike.
According to data from Johns Hopkins University professor Steve Hanke, there have been more than 60 documented instances of hyperinflation since the 1700s, and in every instance, economic conditions deteriorated so fast that in all cases, national currencies failed, meaning that they lost nearly all of their purchasing power both domestically and internationally.
That begs a key question: Could hyperinflation come in the United States? And, if so, could hyperinflation take down the U.S. dollar and trigger a recession?
Theoretically, the answer is “possibly.” Realistically, the answer is “not likely.” Let’s take a look at hyperinflation and evaluate the possibility of inflation on steroids taking root in the U.S. economy.
If you’re still not quite clear on what is hyperinflation, economists define the term as when the price of goods and services rises uncontrollably over a specific timeframe, with no short-term economic remedy able to bring those prices back down again.
While figures linked to hyperinflation vary, some economists say hyperinflation occurs when the price of goods and services in a country’s economy rise by 50% over the period of one month.
The causes of hyperinflation typically stem from a skyrocketing boost in a country’s money supply without any accompanying economic growth. That scenario usually occurs when a country’s government essentially prints and spends money in short-term bursts, thus triggering a rise in that country’s money supply.
When a government pursues a high level of short-term economic spending at a rate significantly higher than the country’s gross domestic product (GDP) rate, more money flows through the economy. When that happens, the real value of a nation’s currency declines, the price of goods and services rises, and inflation spikes.
💡 Quick Tip: Before opening an investment account, know your investment objectives, time horizon, and risk tolerance. These fundamentals will help keep your strategy on track and with the aim of meeting your goals.
While U.S. inflation rates and the prices of many goods and services are on the upswing, economists dismiss the notion that U.S. hyperinflation is looming for the country for several reasons. First, it’s important to remember that hyperinflation and inflation aren’t the same thing, and the Federal Reserve would likely raise interest rates if inflation concerns grew.
According to data published in September 2023, the annual U.S. inflation rate was 3.7% for the 12 months that ended in August 2023. That’s a significant drop from June of 2022, when the inflation rate was 9.1%, which was led by certain items such as airline tickets, lumber, and hotel rates. Many economists attributed this to ongoing inventory shortages and supply chain issues and the release of post-pandemic pent-up demand.
Even the largest inflation rate in U.S. history — 23% in June, 1920 — wouldn’t come close to approaching hyperinflation levels of 50% in a month. Still, ongoing inflation is something that the U.S. economy hasn’t seen in more than four decades, and it’s a risk that investors may want to consider when devising their portfolio strategy.
Economists have largely downplayed the chances of a hyperinflation in the USA, but with inflation on the rise, it’s helpful for consumers to get a better grip on hyperinflation, in particular, and on inflation in general.
These are some of the typical causes of hyperinflation:
Like most major global currencies, the dollar trades on foreign currency exchanges. When a country faces inflationary risks, investors grow skittish, and may bypass that country’s currency in favor of more stable currencies. Even without hyperinflation, a weaker dollar can significantly hurt the U.S. economy.
(Hyperinflation is the extreme opposite of what happens during deflation, in which prices for goods and services decline and the value of a currency rises.)
As inflation seeps into an economy, high prices may prompt individuals and businesses to defer or cancel large purchases. Consumers, for example, could hold off buying new homes, new vehicles, or major household appliances. Businesses might postpone big-ticket purchases like heavy machinery, office buildings, and commercial vehicles.
Some investors may hesitate to put money into stocks in a down market. All of those decisions could stall economic growth, as fewer dollars are circulating through the economy.
When inflation occurs, banks and financial institutions may not lend money or extend credit to consumers and businesses, as confidence in the overall economy wanes.
The economic fix for skyrocketing inflation typically comes from a country’s central bank. In the United States, that would be the Federal Reserve. When necessary, the Federal Reserve uses monetary policy to slow rising inflation by curbing the U.S. money supply, often by raising interest rates. Higher interest rates give consumers and businesses more incentive to save and less incentive to spend. That, in turn, slows rising inflation.
Recommended: What Is Monetary Policy?
Inflation eats into real investment returns. As the value of a dollar declines, investors need to earn more than their average return on investment in order to generate the same purchasing power.
**Customer must fund their Active Invest account with at least $10 within 30 days of opening the account.
Probability of customer receiving $1,000 is 0.028%. See full terms and conditions.
Individuals can’t do much to combat hyperinflation on their own. In fact, during hyperinflation, economies and societies can break down or collapse. Fortunately, periods of hyperinflation are rare. And remember, the 3.7% inflation rate as of August 2023 in the U.S. is nowhere near the levels of 50% in a month, which is when many economists believe hyperinflation occurs.
That said, there are things that might help individuals lessen the impact regular or high inflation might have on their investments. These actions include having a balanced and diversified portfolio, and investing in Treasury Inflation-Protected Securities (TIPS), in which the principal amount invested adjusts with inflation.
💡 Quick Tip: Are self-directed brokerage accounts cost efficient? They can be, because they offer the convenience of being able to buy stocks online without using a traditional full-service broker (and the typical broker fees).
Zimbabwe offers a relatively recent example of hyperinflation. Just over a decade ago, Zimbabwe’s inflation rate stood at a staggering 98% daily inflation rate as the country’s economy went into free fall. That means consumer prices doubled on a daily basis.
Today, the Zimbabwe dollar is very weak, as the country continues to struggle with the issues that often lead to hyperinflation, such as an increased money supply, political corruption, and a major decline in economic activity.
Even historically stable country economies have experienced hyperinflation.
In the immediate aftermath of World War I, the Weimer Republic of Germany fell into economic decline due to war reparation debts and significantly reduced economic activity. The German government printed too much money in an effort to handle its economic obligations and to ignite a stagnant economy. The country faced an inflation rate of 323% per month by November, 1923 — that’s an annual inflation rate of three billion percent.
In today’s dollars, the consumer impact of hyperinflation is particularly onerous. For example, a small cup of coffee that normally would cost $3 would cost $22 at a 1,000% inflation rate. Similarly, a rental payment for an apartment in a major U.S. city might normally cost $2,000. With a 1,000% inflation rate, that rent would cost $22,000.
Hyperinflation also exists on the world’s economic stage in 2023. Venezuela, for example, has an estimated inflation rate of about 400%.
While hyperinflation is certainly an economic condition any country would strive to avoid, there’s no compelling evidence suggesting it’s on the U.S. economic horizon — now or anytime in the near future. Still, the country has been in an inflationary period since 2022, so investors may consider using some inflation-hedging strategies to reduce its impact.
Ready to invest in your goals? It’s easy to get started when you open an investment account with SoFi Invest. You can invest in stocks, exchange-traded funds (ETFs), and more. SoFi doesn’t charge commissions, but other fees apply (full fee disclosure here).
Invest with as little as $5 with a SoFi Active Investing account.
Inflation is the rate at which prices for goods and services are rising in a given economy. Hyperinflation is considered out-of-control inflation, at levels of about 50% in one month, and it can be a sign that a severe economic crisis is on the horizon.
No. The closest the U.S. has come to hyperinflation is when annual inflation peaked at almost 30% during the Revolutionary War in 1778.
Signs that might suggest that hyperinflation could happen include significant price increases of goods and services (such as increases of 50% in one month), the value of a country’s currency plummets, and economic activity slows or stops.
Hyperinflation is quite rare, especially in countries with a central bank, like the Federal Reserve, that works to control inflation. However, there are things an investor might do to help limit the impact regular inflation might have. This includes having a balanced and diversified portfolio, and investing in Treasury Inflation-Protected Securities (TIPS), in which the principal invested adjusts with inflation.
Photo credit: iStock/milindri
Third-Party Brand Mentions: No brands, products, or companies mentioned are affiliated with SoFi, nor do they endorse or sponsor this article. Third-party trademarks referenced herein are property of their respective owners.
Financial Tips & Strategies: The tips provided on this website are of a general nature and do not take into account your specific objectives, financial situation, and needs. You should always consider their appropriateness given your own circumstances.
SoFi Invest®
The information provided is not meant to provide investment or financial advice. Also, past performance is no guarantee of future results.
Investment decisions should be based on an individual’s specific financial needs, goals, and risk profile. SoFi can’t guarantee future financial performance. Advisory services offered through SoFi Wealth, LLC. SoFi Securities, LLC, member FINRA / SIPC . SoFi Invest refers to the three investment and trading platforms operated by Social Finance, Inc. and its affiliates (described below). Individual customer accounts may be subject to the terms applicable to one or more of the platforms below.
1) Automated Investing—The Automated Investing platform is owned by SoFi Wealth LLC, an SEC registered investment advisor (“Sofi Wealth“). Brokerage services are provided to SoFi Wealth LLC by SoFi Securities LLC, an affiliated SEC registered broker dealer and member FINRA/SIPC, (“Sofi Securities).
2) Active Investing—The Active Investing platform is owned by SoFi Securities LLC. Clearing and custody of all securities are provided by APEX Clearing Corporation.
3) Cryptocurrency is offered by SoFi Digital Assets, LLC, a FinCEN registered Money Service Business.
For additional disclosures related to the SoFi Invest platforms described above, including state licensure of Sofi Digital Assets, LLC, please visit www.sofi.com/legal.
Neither the Investment Advisor Representatives of SoFi Wealth, nor the Registered Representatives of SoFi Securities are compensated for the sale of any product or service sold through any SoFi Invest platform. Information related to lending products contained herein should not be construed as an offer or prequalification for any loan product offered by SoFi Bank, N.A.
SOIN0723108
Source: sofi.com
“All of ours are relationship referral-based,” he added, emphasizing the company’s focus on cultivating genuine connections. Dunn’s dedication to face-to-face interactions and attending real estate closings ensures clients receive personalized attention. “I feel like I’m very good at developing relationships with people. For me, it’s much more relational, but it is a lot of hard … [Read more…]
A full decade after U.S. housing markets were crushed by the so-called Great Recession, which led to a major crisis that saw thousands of homes foreclosed upon, things have improved drastically since then. Home values have risen to record highs in many markets, well above pre-recession levels, and foreclosures have fallen to historic lows.
Lawrence Yun, chief economist of the National Association of Realtors, said that lending and regulatory reforms have also helped to prevent a new housing bubble from forming, in spite of concerns from other experts.
“Over the past 10 years, prudent policy reforms and consumer protections have strengthened lending standards and eliminated loose credit, as evidenced by the higher-than-normal credit scores of those who are able to obtain a mortgage and near record-low defaults and foreclosures, which contributed to the last recession,” Yun said. “Today, even as mortgage rates begin to increase and home sales decline in some markets, the most significant challenges facing the housing market stem from insufficient inventory and accompanying unsustainable home price increases.”
But even though inventory continues to be a problem, Yun says that overheating markets are likely to slow down soon. He said that many of the fastest growing markets are seeing prices rise due to insufficient supply rather than strong buyer demand. He added that markets such as Denver and Seattle are already showing signs of slowing down, but said that any fall in home sales is probably going to be connected to supply shortages and price increases.
“The answer is to encourage builders to increase supply, and there is a good probability for solid home sales growth once the supply issue is addressed,” Yun insisted. “Additional inventory will also help contain rapid home price growth and open up the market to prospective home buyers who are consequently—and increasingly—being priced out. In the end, slower price growth is healthier price growth.”
According to Yun, new construction grew by 7.2 percent year-over-year in July, but that’s still not enough to address the inventory shortages. One problem is that builders are struggling with costs, he said.
““Rising material costs and labor shortages do not help builders to be excited about business,” Yun said. “But the lumber tariff is a pure, unforced policy error that raises costs and limits job creation and more home building.”
Yun also thinks existing home sales will fall by around 1 percent to 5.46 million this year. However, he says home value appreciation should remain strong in most markets, rising by about 5 percent on average. Overall home sales should also grow in 2019 due to an increase in supply and moderate price growth, Yun said. he forecasts that existing home sales will rise by 2 percent in 2019, and home prices will rise by 3.5 percent.
Source: realtybiznews.com